
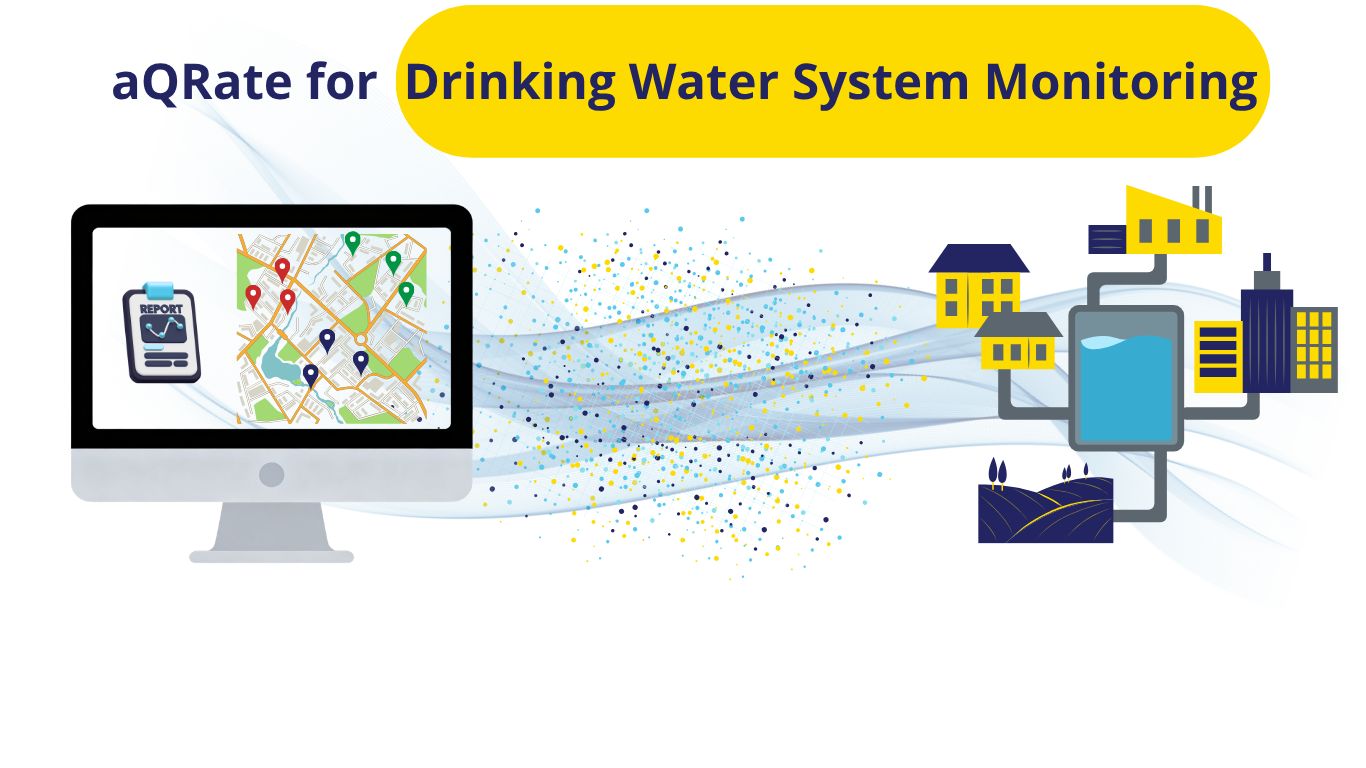
Disclaimer: This is a demo use case engineered to showcase platform capabilities. It was modeled synthetically using the public reporting structures, dashboard formats, station parameters and publicly available water quality reports on Capital Regional District’s website at CRD.ca. While the water quality data in this demo use case is synthetic, the use of sampling location names and water quality reports are subject to CRD's public data policies found here.
Municipal water providers and regional districts face a monumental data challenge. On any given day, field operators are collecting samples and data across hundreds of square kilometers of distribution systems and source water, laboratory teams (either external 3rd party or internal) are performing a variety of water quality tests such as microbiological assays, and compliance officers are wrestling with multi-format spreadsheets to generate regulatory reports.
A diverse group of staff, generating and managing a diverse pool of data, with one shared goal: making sure drinking water is safe for the consumption of their residents.
When data is siloed across different distribution networks, catching trend changes such a dropped residual chlorine in a zone or even issues such logistical conflicts or mismatched testing frequencies becomes nearly impossible.
To show how automation can eliminate this friction, we built a comprehensive demo use case modeled directly after the publicly available water quality framework on CRD.ca (Capital Regional District, Victoria, BC, Canada). Here is a look behind the scenes at how aQRate takes fragmented utility data and transforms it into an audit-ready asset.
The Challenge: Managing the Flow of Fragmented Data
In this use case, the regional footprint is massive. Based on public CRD reports, the system spans 12 distinct water systems - including core urban distribution networks, peripheral water districts, transmission mains, and storage reservoirs - encompassing 191 unique sampling points.
The operational realities of managing this include:
Multi-Format Silos: Concurrently managing weekly field logs, laboratory summaries, and monthly executive compliance dashboards.
Logistical Data Risks: Ensuring that field collection timelines are physically possible and free from manual data-entry errors.
Varying Test Frequencies: Correctly indexing parameters checked during every visit (like Turbidity and Chlorine) against intermittent laboratory assays (like True Colour and Heterotrophic Plate Counts) without creating gaps.
Using the data for insights and decisions: Efficiently managing and using nearly 10,000 sampling events (~150,000 data points) generated annually for data-based decision-making.
How aQRate Solved It: The 4 Pillars of Data Rigor
To bridge the gap between field collection, lab results and municipal compliance, we ingested these public frameworks into aQRate to build a unified, 9,885-row master operational dataset spanning all 52 weeks of the year 2025. The platform provided four critical data integrity tools:
1. Unified Geospatial Mapping
Instead of forcing users to cross-reference alpha-numeric station codes against static maps, aQRate automatically mapped precise decimal GPS coordinates to every unique station code. It then merged raw location descriptions into standardized strings (such as “Kinver S. of Munro (QC2 in meter box)”) enabling instant integration with GIS mapping tools and interactive dashboards.
2. Detailed Compliance
In drinking water distribution system monitoring, every data point can be the difference between compliance and non-compliance. Error free data collection about who, when and where becomes very important since in any compliance dispute, the utility needs to be able to use this historical data and track back every single step. aQRate’s mobile app automatically logs the who, when and where of any data collection event, creating an ironclad audit log for the users.
3. Laboratory Data Integration
In many environmental operations, there are often two sides to the data collection & management: the data that comes from the field, and the data that comes back from the testing laboratory a.k.a lab test results. In data management systems that rely on manual data handling steps, often laboratory reports (pdf or excel files) are processed manually and test results are manually added to the database by cross referencing the sample IDs collected in the field and the sample IDs reported in the lab report. This manual cross referencing is not only time consuming, but it also represents one of the biggest compliance risks in the process: associating a wrong lab data (for example a positive E.coli test result) with a wrong sampling point. aQRate provides a universal AI-Based Laboratory Data module where lab reports (pdf or excel files) are ingested, test results are extracted automatically and auto-linked to the field data, closing the data journey loop.
4. Automated QA/QC Flags and Visualizations
Compliance officers dealing with thousands and thousands of data points often spend a lot of their time combing through the data to detect irregularities, trends and out-of-range measurements (such as low residual chlorine readings in the field). This becomes even a bigger challenge when the data is spread around hundreds of square kilometers of distribution systems. aQRate provides a simple solution for that. Every single data point can have an assigned QC/QA threshold value(s) where if the threshold is met (for example residual chlorine lower than a certain level), the data is automatically colored with a user defined colored tag and text. That way, the compliance officers can find anomalies with one look. aQRate also provides a seamless filter and search tool. On top of that, the AI-based Visualization Engine of aQRate can be used to create interactive dashboards including maps showing all sampling locations and the relevant data.
By automating the schema standardization, catch-logic, and environmental dependencies, aQRate shifts utility teams out of spreadsheet triage and into proactive asset management. With audit-ready data generated instantly, water managers can focus on optimizing chlorine dosing, tracking real-time dead-end flushing schedules, and ensuring total public safety.
For this CRD demo use case, the whole 2025 water quality dataset, including 9,885 sampling events from 12 distinct water systems and 191 unique sampling points can be boiled down to this interactive visualization, providing data to the decision makers at the tip of their fingers. Note that the data was first filtered to contain a specific date range (July 7 to July 21, 2025) for this demo purposes; however, respective visualizations report can be generated for any date range, or for the full dataset with 1-click.
CRD’s Interactive Water Quality Map
Important Notes: While the Visualizations above is an example of the end goal for any project, this level of detailed 1-click report generation would have been impossible without aQRate’s infrastructure in seamless end to end data collection & management. Here is a quick video showing how different components of aQRate play a role in projects like the one above.
Ready to see how aQRate can modernize your team's data workflows? Book a brief 15-minute demo today.
A Note on How This Dataset Was Created:
Using aQRate, we transformed these fragmented, multi-format source files into a unified, 9,885-row master operations dataset for the entire 52 weeks of 2025. Here is how we engineered it to ensure total real-world authenticity. The idea was if CRD had used aQRate in 2025 (field operators using the app to collect field data, office staff using the platform to manage the data and integrate lab data), how the whole data would have looked like:
Geospatial & Description Synchronization: We automatically mapped all 191 sampling points with precise decimal GPS coordinates and merged split labels into clear, system-compliant descriptions.
Enforced Operational Logistics: To make the data audit-believable, we eliminated data-teleportation errors. The system mapped out 4 distinct operators who we had worked with before (Hayden, James, John, and Sam) and ran them through sequential, non-simultaneous 30-minute sampling intervals.
Seasonal Environmental Modeling: We embedded thermodynamic curves to naturally fluctuate water temperatures (3.5 C to 19.5 C) and dynamically calculated corresponding summer chlorine decay rates.
Biochemical Rigor & Lab Formatting: We maintained a strict >99.8% bacterial compliance threshold for E. coli and Total Coliforms, mapped varying test frequencies (daily turbidity vs. periodic HPC and True Colour). I would like to mention that aQRate has a module that allows you to import your lab reports (pdf or excel files) and the platform auto-extracts and auto-links lab data to the field data.