 Synthetic
 Interactive product demos
Read the field story behind each marker.
Filter a simulated program, select a location, and inspect the record that gives the map its meaning.
Synthetic demonstration dataThese scenarios are not operational guidance, customer records, or records of actual incidents.
Synthetic 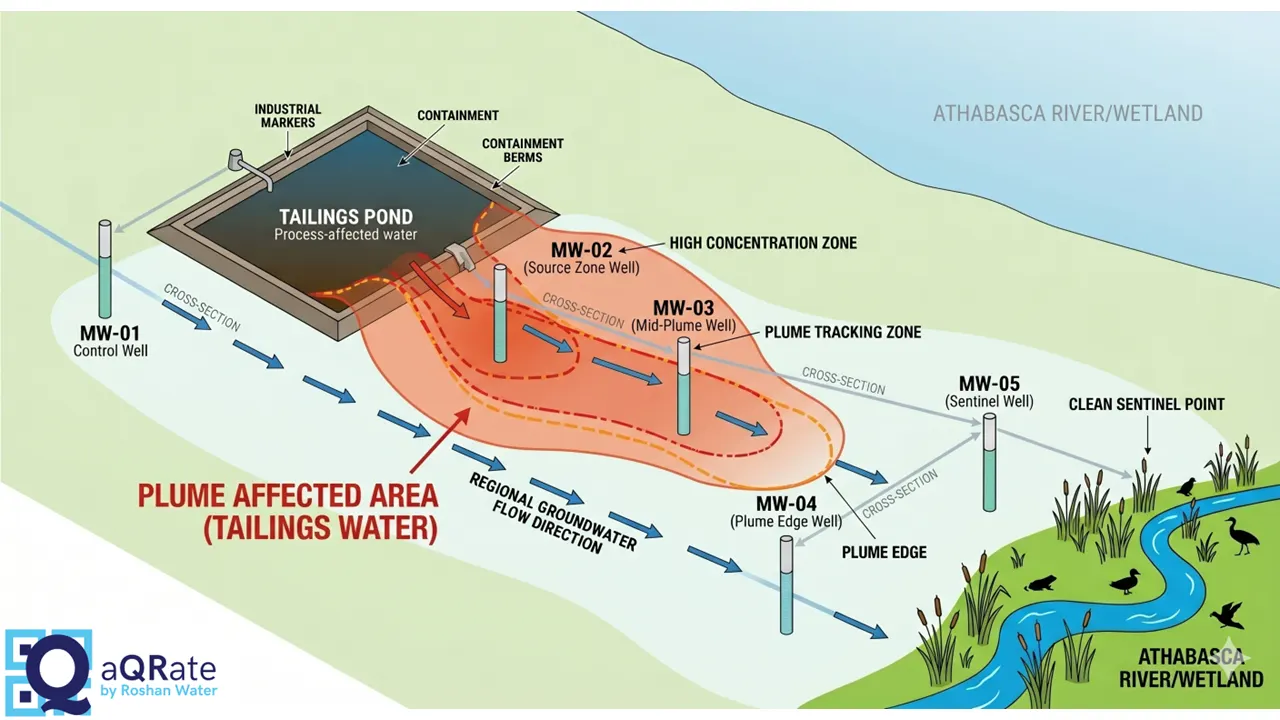 Synthetic
 02
Selected scenarioGroundwater Monitoring
5 monitoring wells12 parameters100 samples
Enter scenario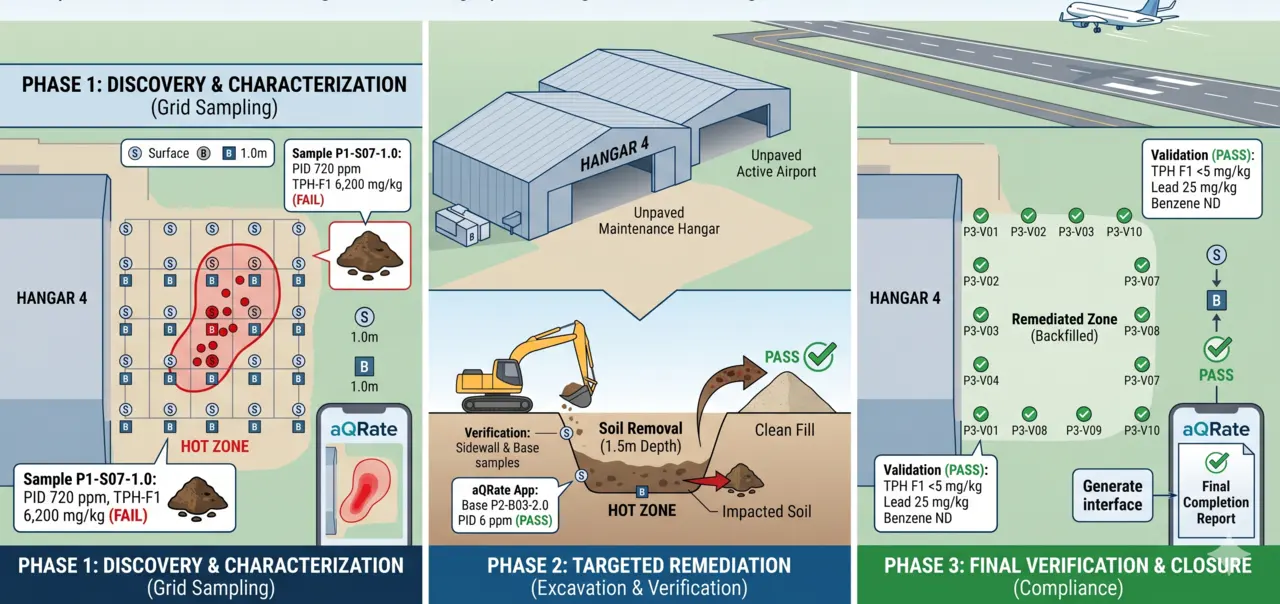 Synthetic
 Choose a scenario
Three programs. One way to inspect the record.
The subject and dataset change, but the interaction stays grounded in the same question: what evidence, result, and context sit behind this location?
01 Interactive Simulated use case
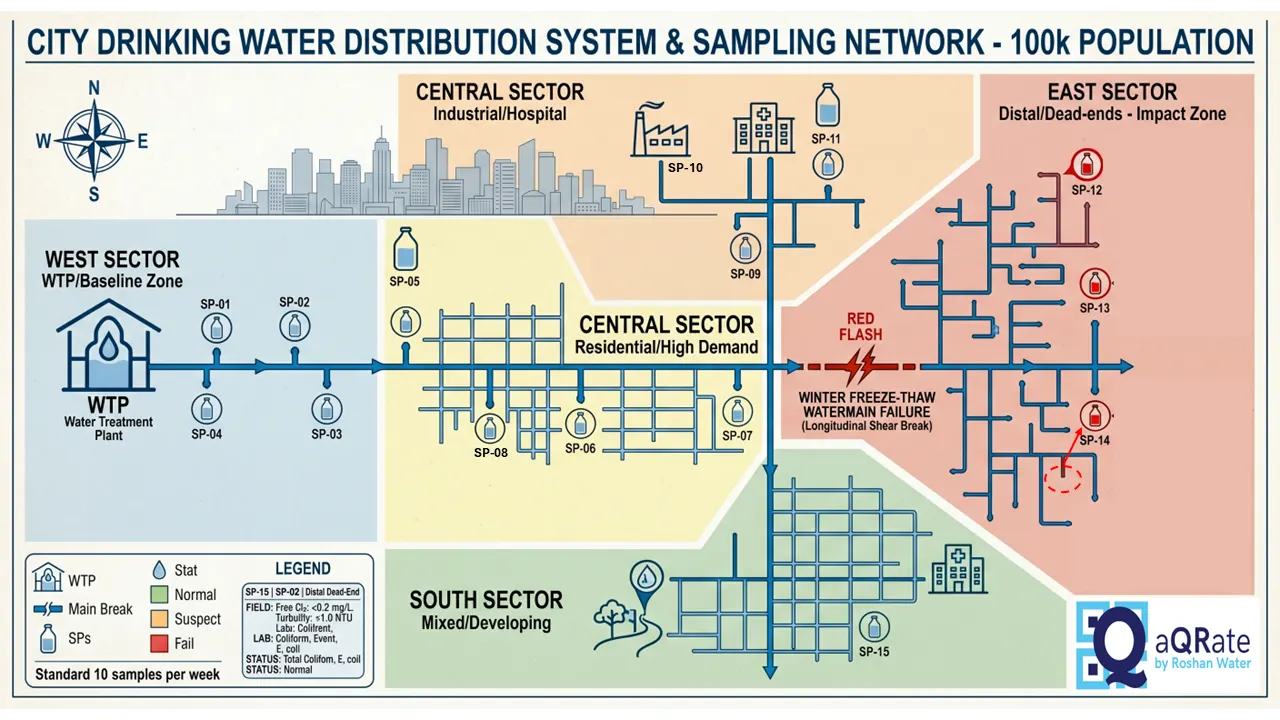
Drinking Water Distribution
Explore chlorine, turbidity, and microbial indicators across a simulated 15-point distribution network.
15 sampling points4 phases40 samples
- 01Select a monitoring phase
- 02Choose a sampling point
- 03Inspect the simulated record
02 Interactive Simulated use case
Groundwater Monitoring
Switch between parameters and follow a simulated groundwater monitoring program through baseline, treatment, and follow-up.
5 monitoring wells12 parameters100 samples
- 01Select a parameter
- 02Compare wells and phases
- 03Open the synthetic lab result
03 Interactive Simulated use case
Soil Contamination Cleanup
Filter a simulated former-airfield dataset by phase and inspect the depth and laboratory results behind each marker.
66 sample points3 phases5 × 5 m grid
- 01Filter by remediation phase
- 02Choose a grid marker
- 03Review field and lab context
How to read these demosAll locations, readings, sample results, thresholds, and incident narratives are synthetic and exist only to demonstrate interface and workflow behavior.
What the demos reveal
A map is useful when the record behind it is clear.
These scenarios are not intended to model environmental decisions. They demonstrate how a user can move from a program view into the supporting record.
Narrow the viewFilter by phase, parameter, or program state.
Select a locationChoose the point, well, or grid marker that needs attention.
Inspect the recordRead the structured field and laboratory context behind it.
Understand the outputSee how organized evidence can support review and reporting.
Move from synthetic to specific
Bring your own record structure.
The useful next step is not to replace the synthetic values with customer data in public. It is to review the real form, permissions, map context, and output privately with your team.
Request a workflow-specific demoStart with your workflow
Want to explore your own dataset this way?
Talk with us about the records, map context, and review workflow your team needs.