
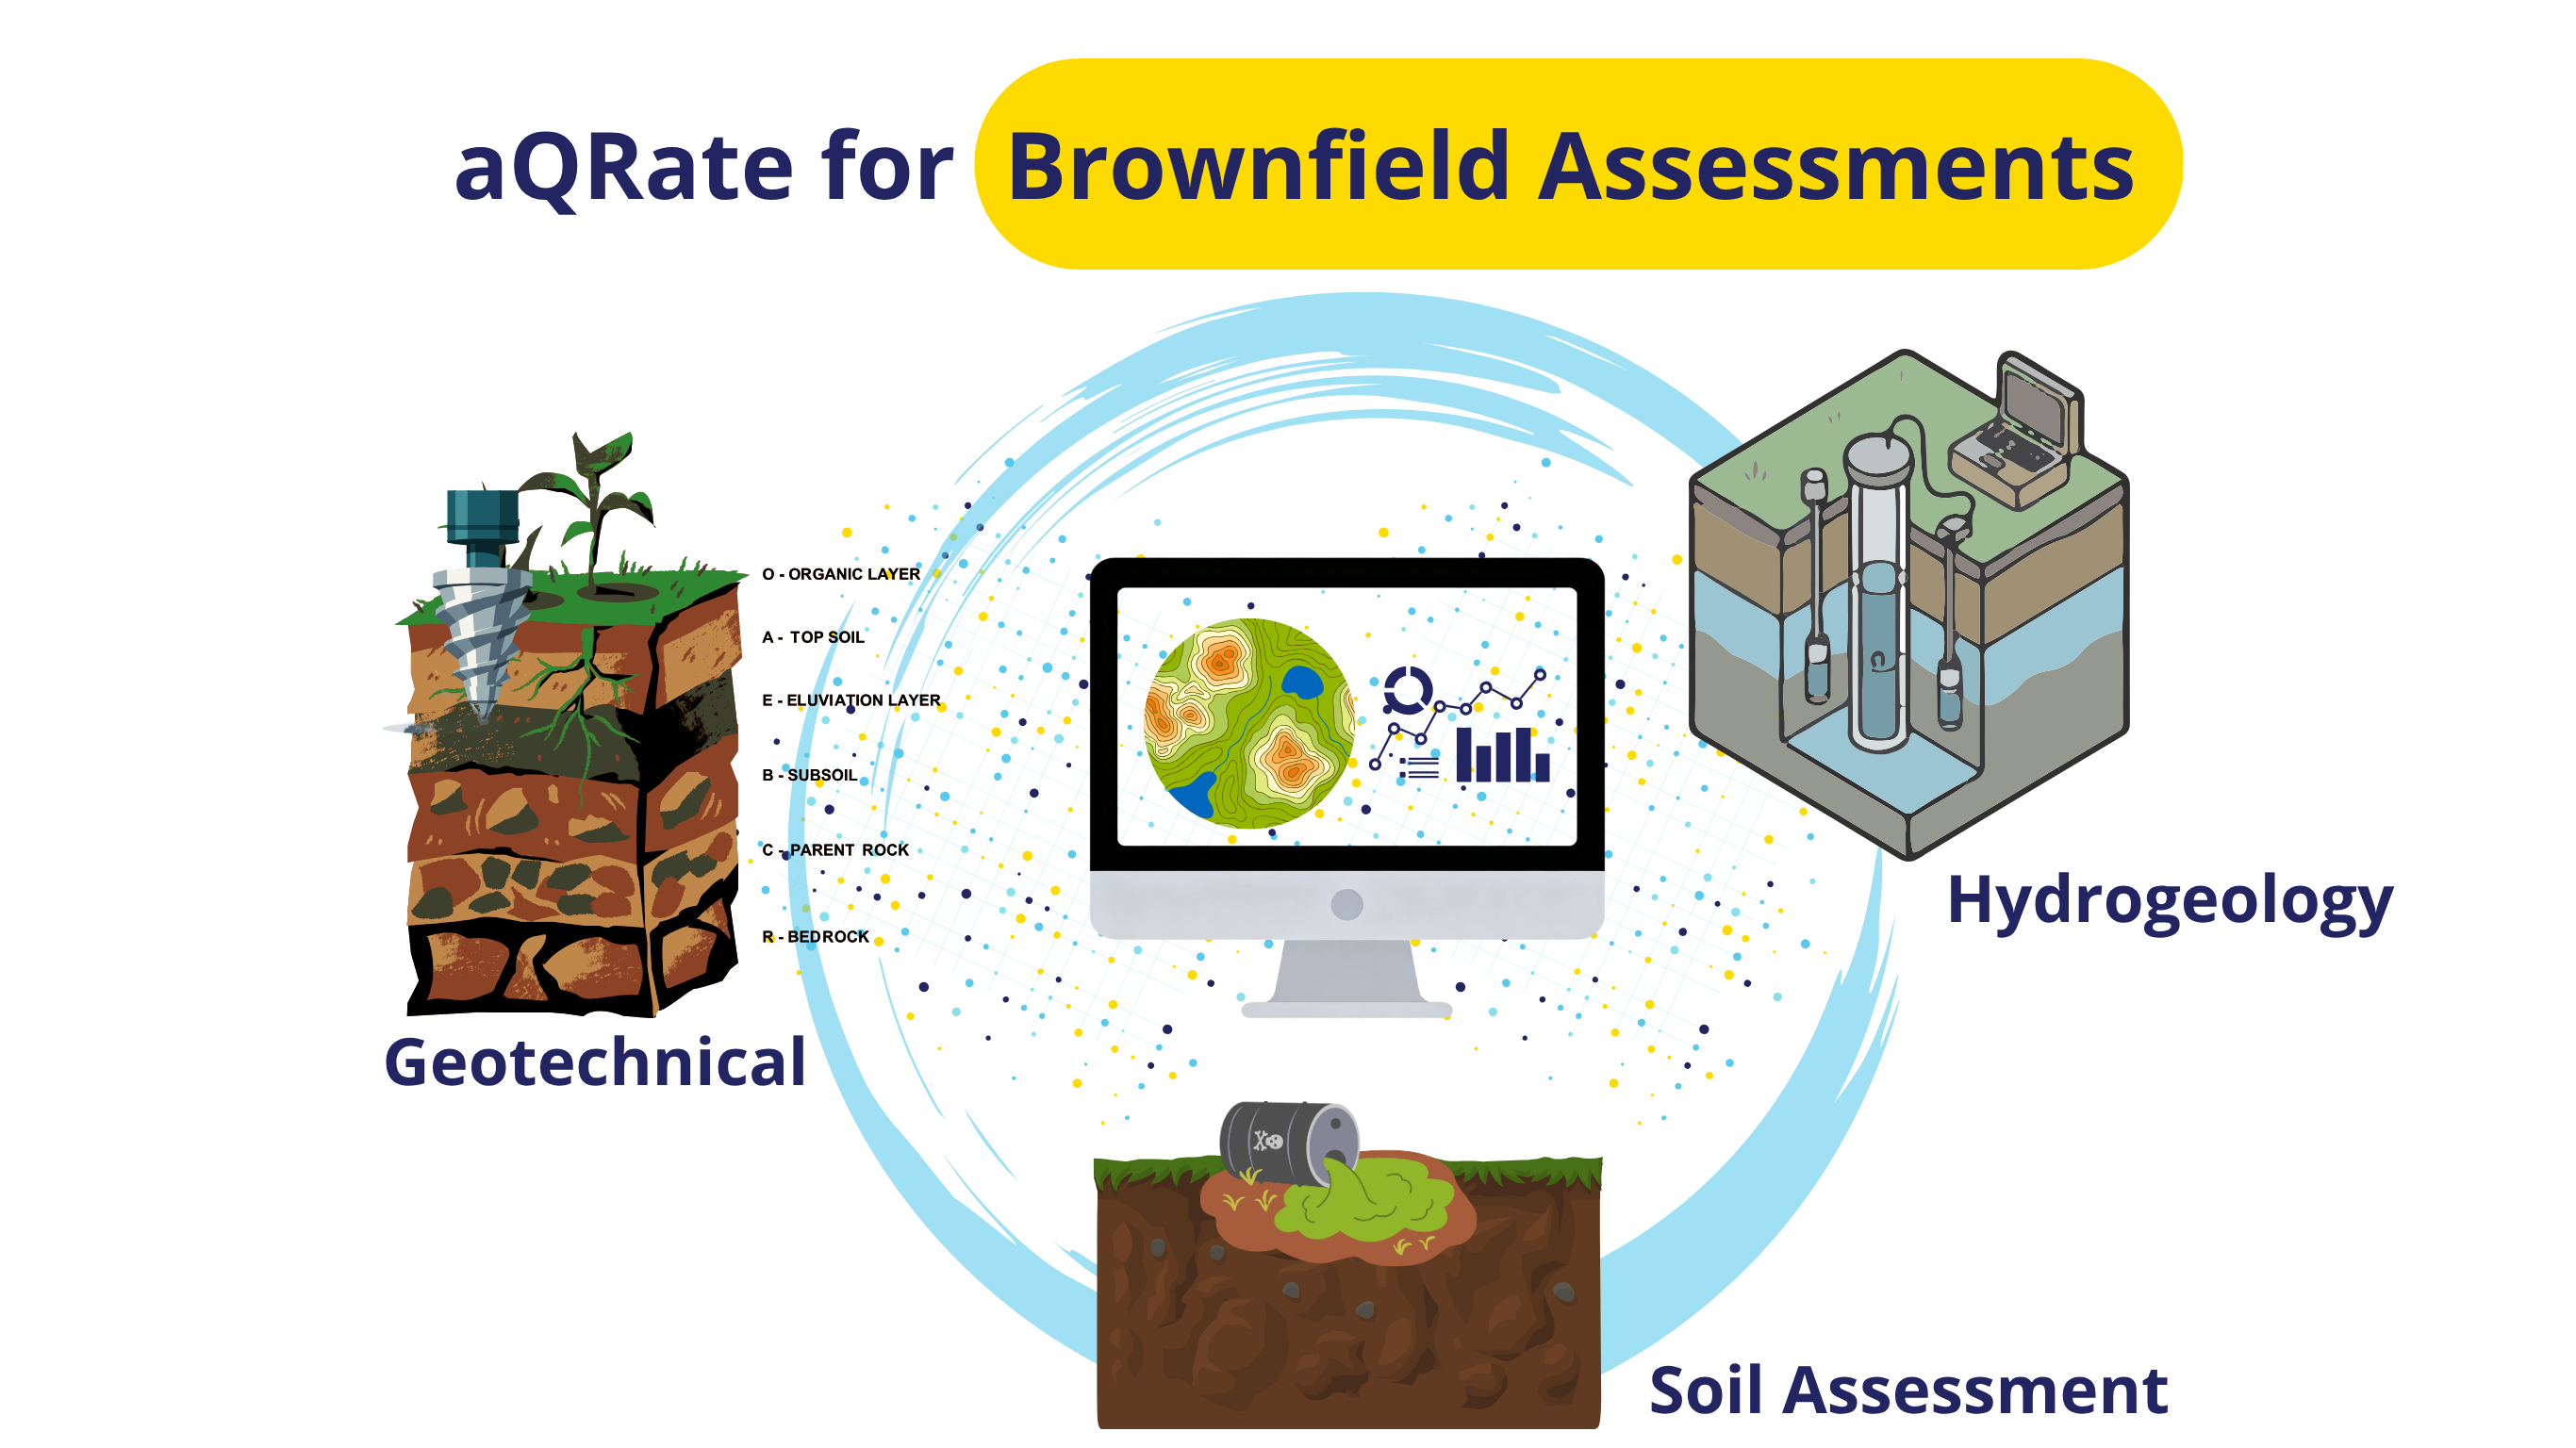
Every multi-disciplinary engineering firm knows the unspoken truth of environmental site characterization: internal data silos are incredibly expensive. When a project moves from high-stakes field logging to office modeling, data gets lost in translation.
Consider a typical high-stakes urban brownfield redevelopment project such as converting a historical retail fuel station from Commercial Land (CL) to High-Density Residential Land (RL). To clear the site for construction, three different teams (Geotechnical, Environmental, and Hydrogeology) must capture different aspects of the subsurface and extent of potential contamination.
If your data platform is rigid, your teams spend more time fighting spreadsheets than solving problems. Here is a demo use case showing how a single project unfolded day by day, and how aQRate’s flexible data engine kept everyone connected in real time, providing data-based insights at every step of the way. The data used in this demo use case is synthetic for demo purposes only, however, aQRate was used in every single step to collect and manage the data.
Day 1: Investigating the Core Hotspots (BH-01 to BH-04)
The drilling rig spun up at 08:15 AM on the first day of the campaign. The objective was to drill the four primary Areas of Potential Environmental Concern (APECs) - the tank farm, pump islands, mechanical sump, and waste oil tank.
In the Field: The Geotechnical team used aQRate's mobile interface to log continuous micro-stratigraphic sub-layers using standard Unified Soil Classification System (USCS) drop-downs. They identified a critical structural interface: a highly permeable fine-to-coarse sand layer (SP) terminating sharply at a dense clay confining layer (CL) at 4.2 meters.
The Environmental Shift: Working right alongside the drillers, the Environmental team collected soil cores, screening them with a Photoionization Detector (PID). In aQRate, they mapped their samples directly onto the geotech's live stratigraphic skeleton using a clean, synchronized naming format: BH-xx-To(m).
The aQRate Advantage: In a traditional workflow, the environmental team wouldn't see the geotech logs for weeks. With aQRate, as soon as sample BH-01-3.5 registered a massive field PID spike of 845 ppm with a heavy petroleum odor, the environmental team could look at the tablet and instantly see why: the hydrocarbon contamination was actively migrating down through the permeable sand and pooling horizontally on top of the geotech's dense 4.2-meter clay floor.
Day 2: Chasing the Plume Boundaries (BH-05 to BH-08)
With the source areas confirmed on Day 1, Day 2 was all about delineation. The rig stepped out North, South, East, and West to find where the soil contamination ended.
In the Field: The crews logged four step-out boreholes (BH-05 through BH-08). The challenge here was handling sparse geotechnical numerical data. Standard Penetration Tests (SPT_N) were only driven every 1.5 meters, leaving empty rows in the database, while the lithological text descriptions remained continuous.
The aQRate Advantage: Traditional databases crash or misalign rows when numerical columns contain null values alongside continuous text. aQRate’s flexible architecture natively handled this sparse data, allowing the field engineers to input soil descriptions without throwing system errors, while the environmental team mapped step-out sample IDs (like BH-05-1.5 and BH-07-3.0) directly to their exact depths.
Day 3: Establishing the Native Baseline (BH-09 & BH-10)
On the final day of drilling, the rig moved upgradient to the northern edge of the property to install two background reference holes (BH-09 and BH-10).
In the Field: The subsurface changed completely. The sand and clay disappeared, replaced by highly compact, dense gray Glacial Till (TILL). Drilling resistance skyrocketed, with SPT_N values climbing above 45 blows per foot, bordering on refusal limits.
The aQRate Advantage: Because aQRate doesn't force a one-size-fits-all data structure, the logging schema adapted instantly. The team quickly switched parameters from soft alluvial descriptions to heavy glacial till matrices without changing apps or altering the project database. By the end of Day 3, the drilling campaign wrapped up with a flawless, gap-free physical and chemical soil profile of the entire site.
Two Weeks Later: Mapping the Fluid Dynamics
With the boreholes completed and converted into permanent groundwater monitoring wells (MW-01 through MW-09), the Hydrogeology team arrived on-site for the final phase of the characterization program.
In the Field: The hydrogeologists purged the wells and logged specialized groundwater parameters: Top of Casing (TOC) surveyed elevations, Electrical Conductivity (EC), pH, temperature, and Depth to Water (DTW). The team also obtained water samples for submission to the 3rd party lab for water chemistry analysis. Sampling location, time and date were collected automatically, and laboratory Chain of Custody (CoC) were prepared by aQRate with 1 click.
The aQRate Advantage: This is where cross-team flexibility delivers its highest return on investment. Instead of waiting days to process coordinates in standalone software, aQRate automatically executed a 3-point spatial triangulation using the pre-existing survey coordinates and the new fluid levels.
The engine mapped a uniform water table sloping downward to the Southwest. It then automatically used the Day 2 porosity data (ne = 0.25) based on the logs by the geotech team and combined it with the aquifer's hydraulic conductivity constants (K) to solve Darcy’s Seepage Velocity vector formula automatically.
When the analytical laboratory provided the water chemistry results, staff imported the lab reports (pdf or excel files) into aQRate and the platform extracted the results and auto-linked them to the field data, closing the loop of data journey. In the next step, through the platform's Visualizations module, aQRate plotted a severe dissolved Benzene plume (112.0 ug/l at MW-02). By combining the calculated water velocity vectors with the plume boundaries, aQRate’s predictive risk module determined that the front edge of the plume (8.5 ug/l at MW-05) was traveling southwest and would breach the off-site residential property boundary in exactly 245 days.
Here are examples of the output of the Visualizations module for various steps of this project:
Click here for 👉 Geotechnical & Environmental Assessment Soil Data
On top, you can choose between Geotechnical View and Soil Assessment View. The Geotechnical View visualizes all the borehole logs along with their respective stratigraphic layers, SPT-N charts, etc. The Soil View visualizes the soil assessment data (VOC-PID measurements in the field, chemical analysis data from lab, etc.) in 3D format, as well as in 2D alongside respective stratigraphic view of the boreholes.
Click here for 👉 Hydrogeological Data and Modeling
The Operational ROI of Flexibility
By providing a data framework flexible enough to support the unique day-to-day timeline of Geotechnical, Environmental, and Hydrogeological divisions, aQRate delivered clear bottom-line results:
35% Reduction in Project Lifecycles: No manual data re-entry, transposition steps, or disconnected spreadsheet adjustments between field shifts and office reporting.
Flawless Quality Control: Built-in business logic validation rules ensured that no soil sample ID or water level depth could be entered outside the physical constraints of the well screens.
Minimized Soil Disposal Costs: High-precision boundary integration allowed the engineering firm to confidently isolate contaminated hot zones from clean soil, saving the developer thousands of dollars in landfill fees.
Flexibility isn't just a software feature; it's a massive competitive advantage. When your data platform speaks every engineering language fluently, your organization can stop chasing spreadsheets and focus on delivering successful projects.
Important Notes: While the Visualizations above is an example of the end goal for any project, this level of detailed 1-click report generation would have been impossible without aQRate’s infrastructure in seamless end to end data collection & management. Here is a quick video showing how different components of aQRate play a role in projects like the one above.
Ready to see how aQRate brings efficiency and insights to your field data collection & management operations?