
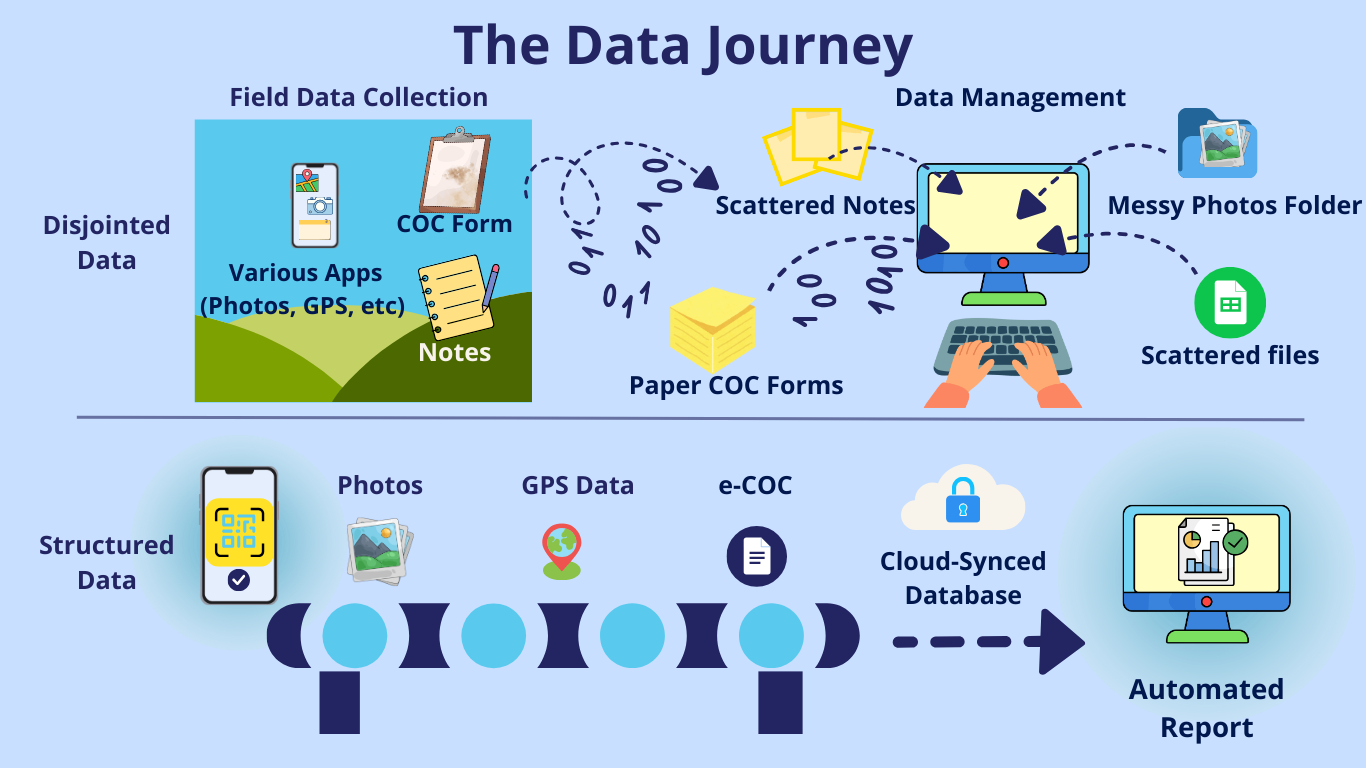
In the world of environmental consulting and hazmat inspection, our final product isn't just a site visit or a laboratory result. Our product is defensible information. Whether it’s an asbestos survey for a high-rise, a Phase I ESA for a commercial developer, or lead-paint sampling for a municipal project, the value we provide lies in the accuracy and integrity of our reports. Yet, in most firms, the "data life cycle" is a broken, fragmented process that bleeds profit and exposes the company to massive liability.
Below, we follow the life of a single data point from the moment it's captured in the field to the moment it hits the CEO’s desk. Along the way, we’ll see why the current "standard" way of working is actually a "Game of Telephone" that no one wins.
Stage 1: The Field – The "Juggler’s" Dilemma
Involved staff: The Field Technicians / Scientists
The data journey begins in the field. Here, the data is born, usually in a chaotic environment: a construction site, a dark basement, or a high-traffic industrial zone.
The Reality: To capture all pieces of data, the tech has to juggle a physical clipboard (for logs), a smartphone (for photos), a GPS unit (for coordinates), and perhaps a separate tablet for an old-school database app.
The Friction: This is App Fatigue. When a technician has to switch between five different tools to document all required data, the risk of a "capture error" skyrockets. Fatigue sets in, and the focus shifts from "building the foundation of the project with data" to "managing the gear."
The Result: Data is captured in fragments. A photo on a phone, a note on a piece of paper, and a location on a GPS. These fragments are not yet "information"—they are just a mess of disconnected clues.
Stage 2: The Hand-off – Entering the "Transcription Trap"
Involved staff: The Project Manager (PM)
Once the field crew returns, the data enters the most expensive stage of its life: the office.
The Reality: The Project Manager (PM) receives a stack of paper Chain of Custody (CoC) forms, a link to a disorganized cloud folder of photos, and a handful of scribbled site notes.
The Friction: The PM now spends 30% to 50% of their billable week acting as a high-paid data entry clerk. They are manually re-typing what the field tech already wrote down.
The "Funnel" Effect: This manual entry creates a massive bottleneck. The PM cannot manage more projects because they are physically stuck "funneling" raw data into internal databases, Excel spreadsheets and Word documents. Every minute spent typing is a minute not spent consulting with clients.
Stage 3: The Quality Gate – The Degradation of Truth
Involved staff: The QA/QC Manager / Senior Principal
Now the report is "finished," but before it can be signed, it must be verified. This is where the cracks in a manual workflow become craters.
The Reality: The QA Manager compares the final report against the original field notes.
The Friction: They find a discrepancy. Is sample #102 "Positive" or "Pending"? In the manual "Telephone Game," a "5" written in the field often becomes an "S" in the office.
The Risk: This isn't just a typo; it’s a Compliance Crisis. If a senior principal signs off on a report with corrupted data, the firm's Professional Liability (E&O) insurance is on the line. The result? The report is sent back to Stage 2, starting a "Vicious Cycle" of edits that erodes the project's profit margin to zero.
Stage 4: The Boardroom – The 40% Growth Tax
Involved staff: The COO / CEO
While the staff struggles with the data, the leadership team is looking at the P&L statements.
The Reality: The firm is busy—busier than ever. Yet, the margins are thin, and the firm can't seem to scale.
The Friction: This is the 40% Resource Drain. Leadership realizes that for every 10 staff members they hire, they only get the output of 6. The other 4 are effectively "lost" to the friction of manual data management.
The Scaling Wall: The firm wants to win larger or more contracts, but they know their current reporting "funnel" would break under the volume. They are anchored to their current size by their own inefficiency.
Stage 5: The Infrastructure – The Shield and the Shadow
Involved staff: The IT Director / CTO
Behind the scenes, the IT department is trying to keep the firm’s digital house in order.
The Reality: Employees start using "Shadow IT"—sending site photos via email, storing field notes on personal Google Drives, or storing sensitive client data on their personal devices.
The Friction: This creates a massive security hole. Data integrity is lost because there is no "Single Source of Truth." If a server fails or an employee leaves, critical project data vanishes with them. The IT Director is stuck in a reactive "defense" mode, unable to build a strategic tech stack because they are too busy patching leaks. In a recent interview with a hazmat inspection firm, the general manager said:
“Recently, our firm did an audit of the projects we completed in the past 5 years, and we realized that 40-50 of the project files are either missing completely or have missing information. We suspect that the manual task of archiving all project files was not done fully”.
The Solution: Building the "Data Conveyor Belt"
The journey of a data point shouldn't be a struggle; it should be an automated flow. Imagine a world where:
Field Techs capture data once on a single device, automatically syncing photos to logs.
Project Managers receive pre-populated reports, eliminating manual transcription entirely.
QA Managers have instant "Audit Trails" to verify data at the source.
CEOs see a 40% increase in billable capacity without adding a single new hire.
In our next post, we will dive deep into Stage 1 and look at how to fix the "Juggler’s Dilemma" in the field.