
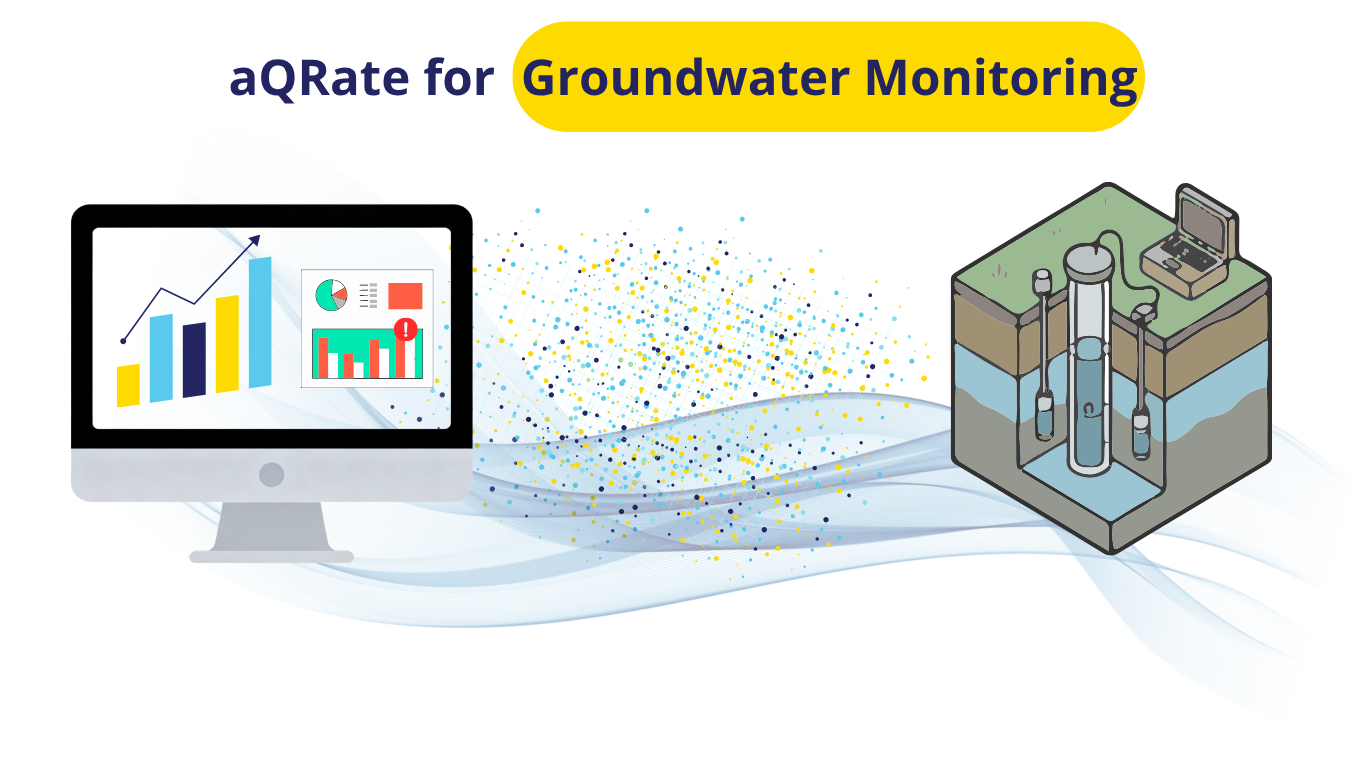
For environmental managers, hydrogeologists, and compliance teams, long-term groundwater monitoring is a double-edged sword. On one hand, a decade of quarterly data provides an invaluable historical record. On the other hand, analyzing 10 years of interconnected field and laboratory parameters across an entire monitoring network using traditional spreadsheets is slow, prone to human error, and statistically limiting.
To showcase how modern cloud analytics can revolutionize this workflow, we have released the aQRate Groundwater Trend Case Study. This interactive asset details a 10-year quarterly monitoring program across three distinct wells, tracking critical field indicators (Depth to Water, EC, pH, Temperature) alongside laboratory suites (TDS, major ions, and heavy metals).
The goal? To demonstrate how the aQRate platform instantly extracts actionable environmental insights from dense compliance networks.
The Problem with Traditional Analysis
Standard linear trendlines (like those built into standard spreadsheet software) assume that data is normally distributed and completely independent over time. In hydrogeology, this is rarely true. Groundwater data is notoriously "noisy," subject to heavy seasonal fluctuations, and prone to extreme outliers caused by natural seasonal changes or sampling variables.
When you use the wrong statistical tools, you risk two major consequences:
Failing to notice a critical contaminant leak until it has already migrated off-site.
Triggering costly, stressful false alarms over completely benign data spikes.
The aQRate Approach: Intelligent Non-Parametric Analytics
The case study dataset showcases how aQRate uses robust, non-parametric statistical methods—specifically the Mann-Kendall trend test and the Theil-Sen slope estimator—to provide flawless data clarity across three common environmental challenges:
1. Tracking Interconnected Regional Trends
As a regional water table drops, the physical dynamics of the aquifer change. In our case study, aQRate tracks a steady linear increase in the depth to the water table. Simultaneously, the platform automatically flags matching upward trendlines in Electrical Conductivity (EC) and Total Dissolved Solids (TDS). By pairing these trends together, aQRate visually and statistically validates regional aquifer mineralization over a 10-year horizon.
2. Spotting Sudden Breakthrough Events (Well MW-02)
Contamination may introduces itself gradually, or its sudden increase may come from a contamination event. aQRate's AI-based Visualization tool can create dashboards, paired with statistical analysis, to allow trend monitoring as data (field or lab) hit the platform. In the case of Well MW-02, heavy metal metrics (Arsenic) remain at a completely stable, safe baseline for the first five years of the program before experiencing a sharp, sudden spike in Year 6. This level of visualizations assists teams to make data-based decisions on the spot, executing immediate remediation strategies.
3. Filtering Out Ambient Data Noise
To prove the platform’s mathematical precision, laboratory Iron (Fe) metrics were monitored under highly volatile, high-noise conditions. While standard charting software might flag a false positive trend due to the extreme peaks and valleys, aQRate’s Mann-Kendall engine successfully identifies the data as statistically flat—saving your team from chasing ghost anomalies.
Get the Interactive Portfolio
We believe software should speak for itself. The underlying data for this entire 10-year case study has been packaged into a 🔗👉clean, ready-to-ingest Visualizations.
Important Notes: While the Visualizations above is an example of the end goal for any project, this level of detailed 1-click report generation would have been impossible without aQRate’s infrastructure in seamless end to end data collection & management. Here is a 🔗👉quick video showing how different components of aQRate play a role in projects like the one above.
Ready to see how aQRate can modernize your team's inspection data workflows? 🔗👉Book a brief 15-minute demo today.
.