Drinking Water Distribution
Use Case 01 · From field measurement to crisis response — see how aQRate manages real-time water quality data across a 15-point distribution network.
Case Study
Data-Based Decision Making For Drinking Water Distribution Systems
Note: This is a simulated use case using synthetic data to demonstrate the end-to-end data management capabilities of the aQRate platform.
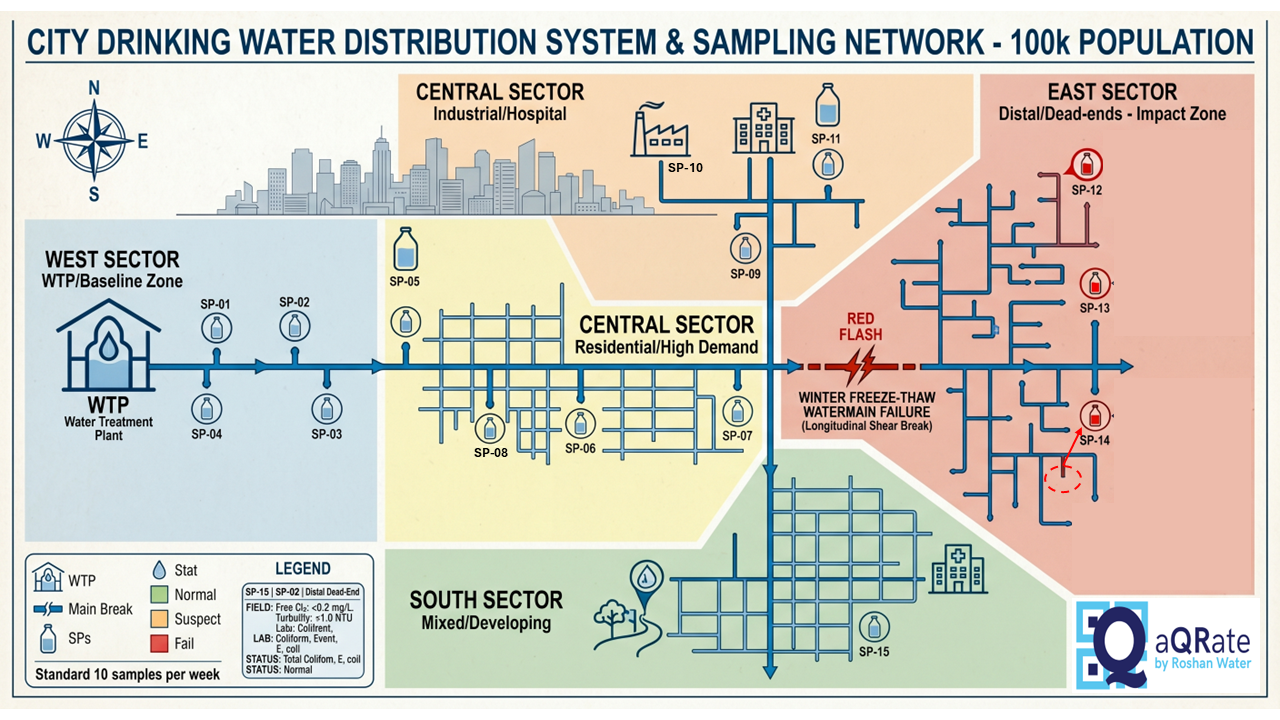
Fig. 1 — City drinking water distribution system & sampling network (100k population). Red markers indicate impact zone sampling points affected by the freeze-thaw main break.
The Challenge: When the Ground Shifts
For a city, winter isn’t just about snow. It’s about the volatile “freeze-thaw” cycles that wreak havoc on aging infrastructure. Here in Edmonton, the latest winter-spring season saw changes of 30 °C during a few days. In this simulation, we look at a rapid temperature spike that triggered a longitudinal shear break in a 12-inch cast-iron trunk line.
The resulting pressure drop created a high-risk scenario: backsiphonage. Contaminated meltwater was pulled into the distribution network, threatening the safety of the East Sector.
Using aQRate for collecting all the field data (including field measurements of residual chlorine and turbidity) and laboratory test results for E. coli and Total Coliforms provides a clear instant picture of the issue as it was happening.
1 The Baseline: 10 Samples, Total Confidence
Before the crisis, the utility’s routine was managed seamlessly. The utility has a fixed schedule of 10 weekly samples from 15 sampling points along the distribution system. Using aQRate, technicians collected 10 GPS-tagged samples per week.
- Field Data: Residual Chlorine and Turbidity were logged instantly via mobile.
- Chain of Custody: Laboratory chain of custody was prepared automatically through the aQRate cloud platform.
- Lab Sync: Coliform and E. coli results were automatically reconciled and the testing lab emailed the test results.
- Visibility: Managers viewed a steady-state dashboard of a healthy system.
2 The Incident: Real-Time Crisis Detection
On January 21st, the ground shifted. As the field team conducted their rounds, aQRate collected all the data and instantly added them to the Manager’s dashboard. The loss of residual chlorine and the spike in turbidity were immediately flagged and showed a critical failure at SP-12.
Because the data was digital and instantaneous, the utility didn’t wait. They issued a localized Boil Water Advisory and deployed repair crews before the lab had even finished incubating the samples.
The Recovery: Data-Driven Restoration
Corrective measures require precision. The utility initiated a “super-chlorination” flush, using aQRate to track the high-strength chlorine residuals (>4.0 mg/L) as they moved through the affected pipes.
To lift the advisory, the regulator required “Three Clean Rounds.” aQRate managed the increased sampling volume, including Field Duplicates (D) and Triplicates (T), ensuring that every Sample ID was traceable and every result was defensible.
The Result: From Crisis to Baseline
By January 24th, the city returned to its steady-state baseline.
Conclusion
This simulation proves that water quality management isn’t just about testing—it’s about the speed of information and communication. With aQRate, data becomes a tool for action, ensuring that even when the infrastructure fails, the safety of the public does not.
Want to see the data behind this simulation? Reach out to us and we will walk through the scenario, dataset and aQRate platform together.
Request a walkthrough