Groundwater Monitoring
Use Case 02 · Plume tracking around a tailings pond, Athabasca River corridor.
Case Study
Demo: The “Legacy Tailings” Integrity Lifecycle
Note: This is a simulated use case using synthetic data to demonstrate the end-to-end data management capabilities of the aQRate platform.
The Premise
A major SAGD (Steam-Assisted Gravity Drainage) operator in the Athabasca Region maintains a network of groundwater monitoring wells. These wells are a regulatory “tripwire” between a secondary tailings pond and a sensitive natural wetland. The company uses aQRate to replace their legacy process of paper field notes, disjointed Excel sheets, and manual lab data entry.
This use case simulates a liner failure in the tailings pond which causes the leakage of contamination to the groundwater sources, creating a Groundwater Under the Direct Influences (GUDI) scenario.
What aQRate provides to this situation is simple: total data connection and clarity. The interactive map above is a simple example. Read below for further explanation of this use case.
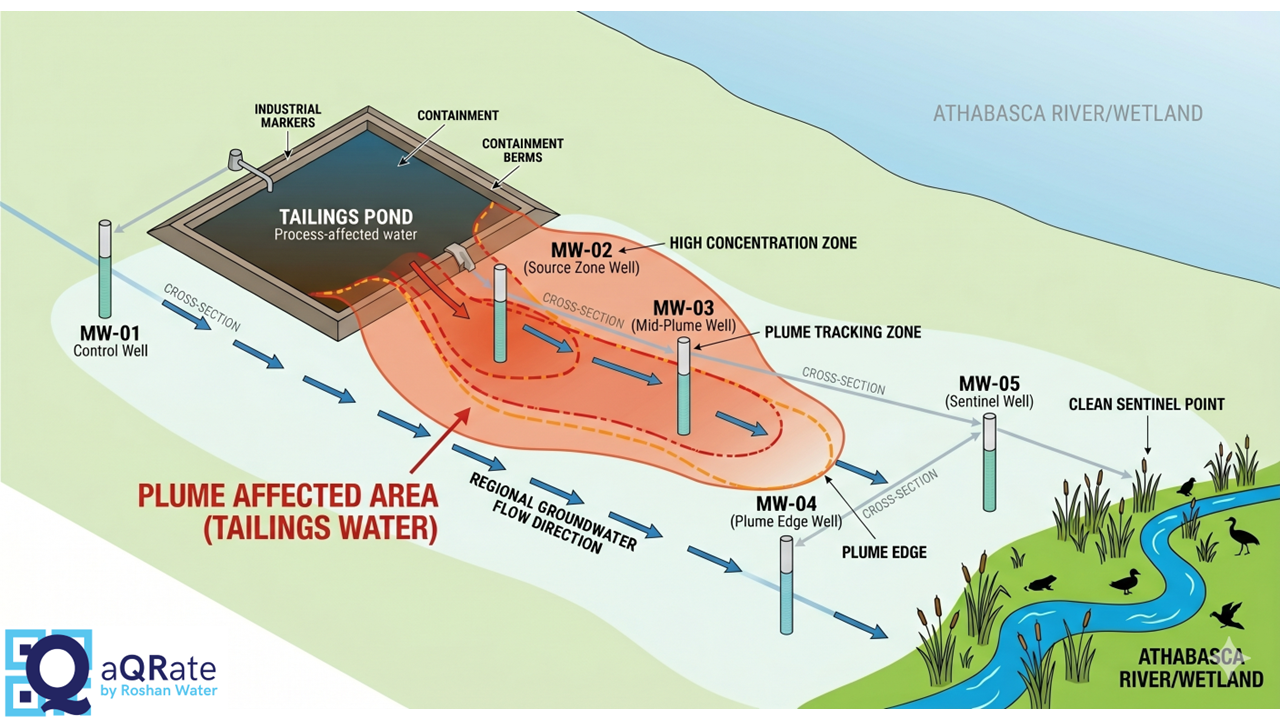
Fig. 1 — Plume affected area showing tailings pond liner failure, groundwater flow direction, and monitoring well network relative to the Athabasca River/Wetland.
1 Period 1: The Routine Months 1–4
The operator performs Monthly Baseline Monitoring to satisfy their EPEA (Environmental Protection and Enhancement Act) approval.
- The Problem: In the past, data sat in a technician’s truck before being typed into a spreadsheet — a delay in communication.
- The aQRate Advantage: Field technicians use the aQRate mobile app to log Depth to Water (m) and Field_EC (µS/cm). Data is synced to the cloud instantly.
- Outcome: Management sees a “Green” dashboard. Historical trend lines for MW-01 through MW-05 are stable, proving the facility’s integrity to the regulator.
2 Period 2: The Detection Month 5 / Week 1
During a routine spring check, the system detects an anomaly.
- The Moment of Discovery: Upon syncing the data, office staff see and flag the Field_EC at MW-02 — a reading of 4,500 µS/cm (a 10× increase).
- The aQRate Advantage: Before the technician even leaves the site, aQRate communicates the data to the Project Manager in Calgary, instantly notifying the spike in conductivity with visualization.
3 Period 3: The Investigation & Remediation Weeks 1–12 after Detection
The company identifies a liner failure and initiates an emergency “Pump and Treat” remediation.
- The Challenge: Sampling frequency is ramped up to Weekly. Data volume increases 400%.
- Task Management: The Manager uses aQRate to schedule weekly recurring “Remediation Tasks” for all 5 wells.
- Lab Integration: As lab results for Naphthenic Acids (mg/L) and Benzene (mg/L) arrive, aQRate automatically merges them with the field data using unique Sample IDs.
- Leading Indicators: The team monitors Field_ORP (mV) as a leading indicator of groundwater health, seeing it slowly return from negative (contaminated) to positive (healthy) values. Together with the lab data, a complete picture of the extent of the issue and the health of the affected groundwater can be drawn.
4 Period 4: Compliance & Close-Out Months 9–12
Remediation is complete. The operator must now prove to the Alberta Energy Regulator (AER) that the site has returned to its baseline state.
- The Challenge: Compiling 12 months of field notes, lab COAs (Certificates of Analysis), and trend graphs usually takes an environmental consultant 40+ hours of manual labour.
- The aQRate Advantage: With one click, the operator generates a Comprehensive Compliance Report.
- The Visual Proof: The report features a “Bell Curve” graph for MW-02, showing the sharp spike in Sodium and Naphthenic Acids, followed by a steady 12-week decline back to the original baseline.
Conclusion
Moving away from traditional disjointed manual data handling (from field to office to lab) towards the end-to-end seamless process that aQRate offers creates a whole suite of benefits for everyone involved:
- Major saving in time and resources by not having to manually copy data into different places.
- Major reduction in errors. In this use case, imagine what crisis a simple Sample ID mistake can cause.
- Use all the data to your advantage. When your data is structured and clean in one place, the applications are limitless.
MW Roles in This Demo
| Well ID | Role / Designation | Location Logic | Behavior in the Story |
|---|---|---|---|
| MW-01 | Up-Gradient (Control) | Located “above” the tailings pond relative to groundwater flow. | The “Reference”: Stays clean throughout the year. Proves background water quality is good and the company isn’t being blamed for someone else’s leak. |
| MW-02 | Source Zone (Impacted) | Directly adjacent to the suspected leak point — the “Smoking Gun.” | The “Crisis”: Shows the highest and earliest spike in Conductivity and Naphthenic Acids. First well to trigger an aQRate Automated Alert. |
| MW-03 | Mid-Plume (Impacted) | Down-gradient from MW-02, in the path toward the wetland. | The “Tracker”: Shows a delayed spike as the plume travels through the soil. Used to calculate the seepage velocity. |
| MW-04 | Plume Edge (Marginal) | Near the lateral boundary of the predicted impact zone. | The “Boundary”: Shows only minor fluctuations. Proves to the regulator that the leak is narrow and hasn’t spread sideways. |
| MW-05 | Sentinel (Compliance) | Between the facility and the natural wetland/river. | The “Protector”: Stays clean the entire time. Proves the “Pump and Treat” system stopped the leak before it reached the natural environment. |
Want to see the data behind this simulation? Reach out to us and we will walk through the scenario, dataset and aQRate platform together.
Request a walkthrough