Soil Contamination Cleanup
Use Case 03 · Three-phase remediation of a former fuel depot, Vulcan, Alberta.
Case Study
Managing the Lifecycle of Soil Remediation: A Hypothetical Hangar 4 Scenario
Note: This is a simulated use case using synthetic data to demonstrate the end-to-end data management capabilities of the aQRate platform.
At Roshan Water, we believe that the best way to demonstrate the power of aQRate is to put it to the test against the most complex environmental challenges. To showcase the end-to-end capabilities of our platform, we have developed a simulated use case based on a hypothetical soil contamination event at an industrial airport facility in Vulcan, Alberta.
This simulation follows the lifecycle of a “Legacy Contamination” event, moving from routine discovery to targeted action and final regulatory compliance. The description provided here is intended to showcase the capabilities of aQRate in streamlining field data collection and management with the goal to:
- Save time and resources for the field and office staff by eliminating manual data handling steps;
- Eliminate errors associated with manual data transcriptions;
- Enable users with data-based decision making, i.e. the data that actually works for your project.
Here is the interactive map generated with the data for this project:
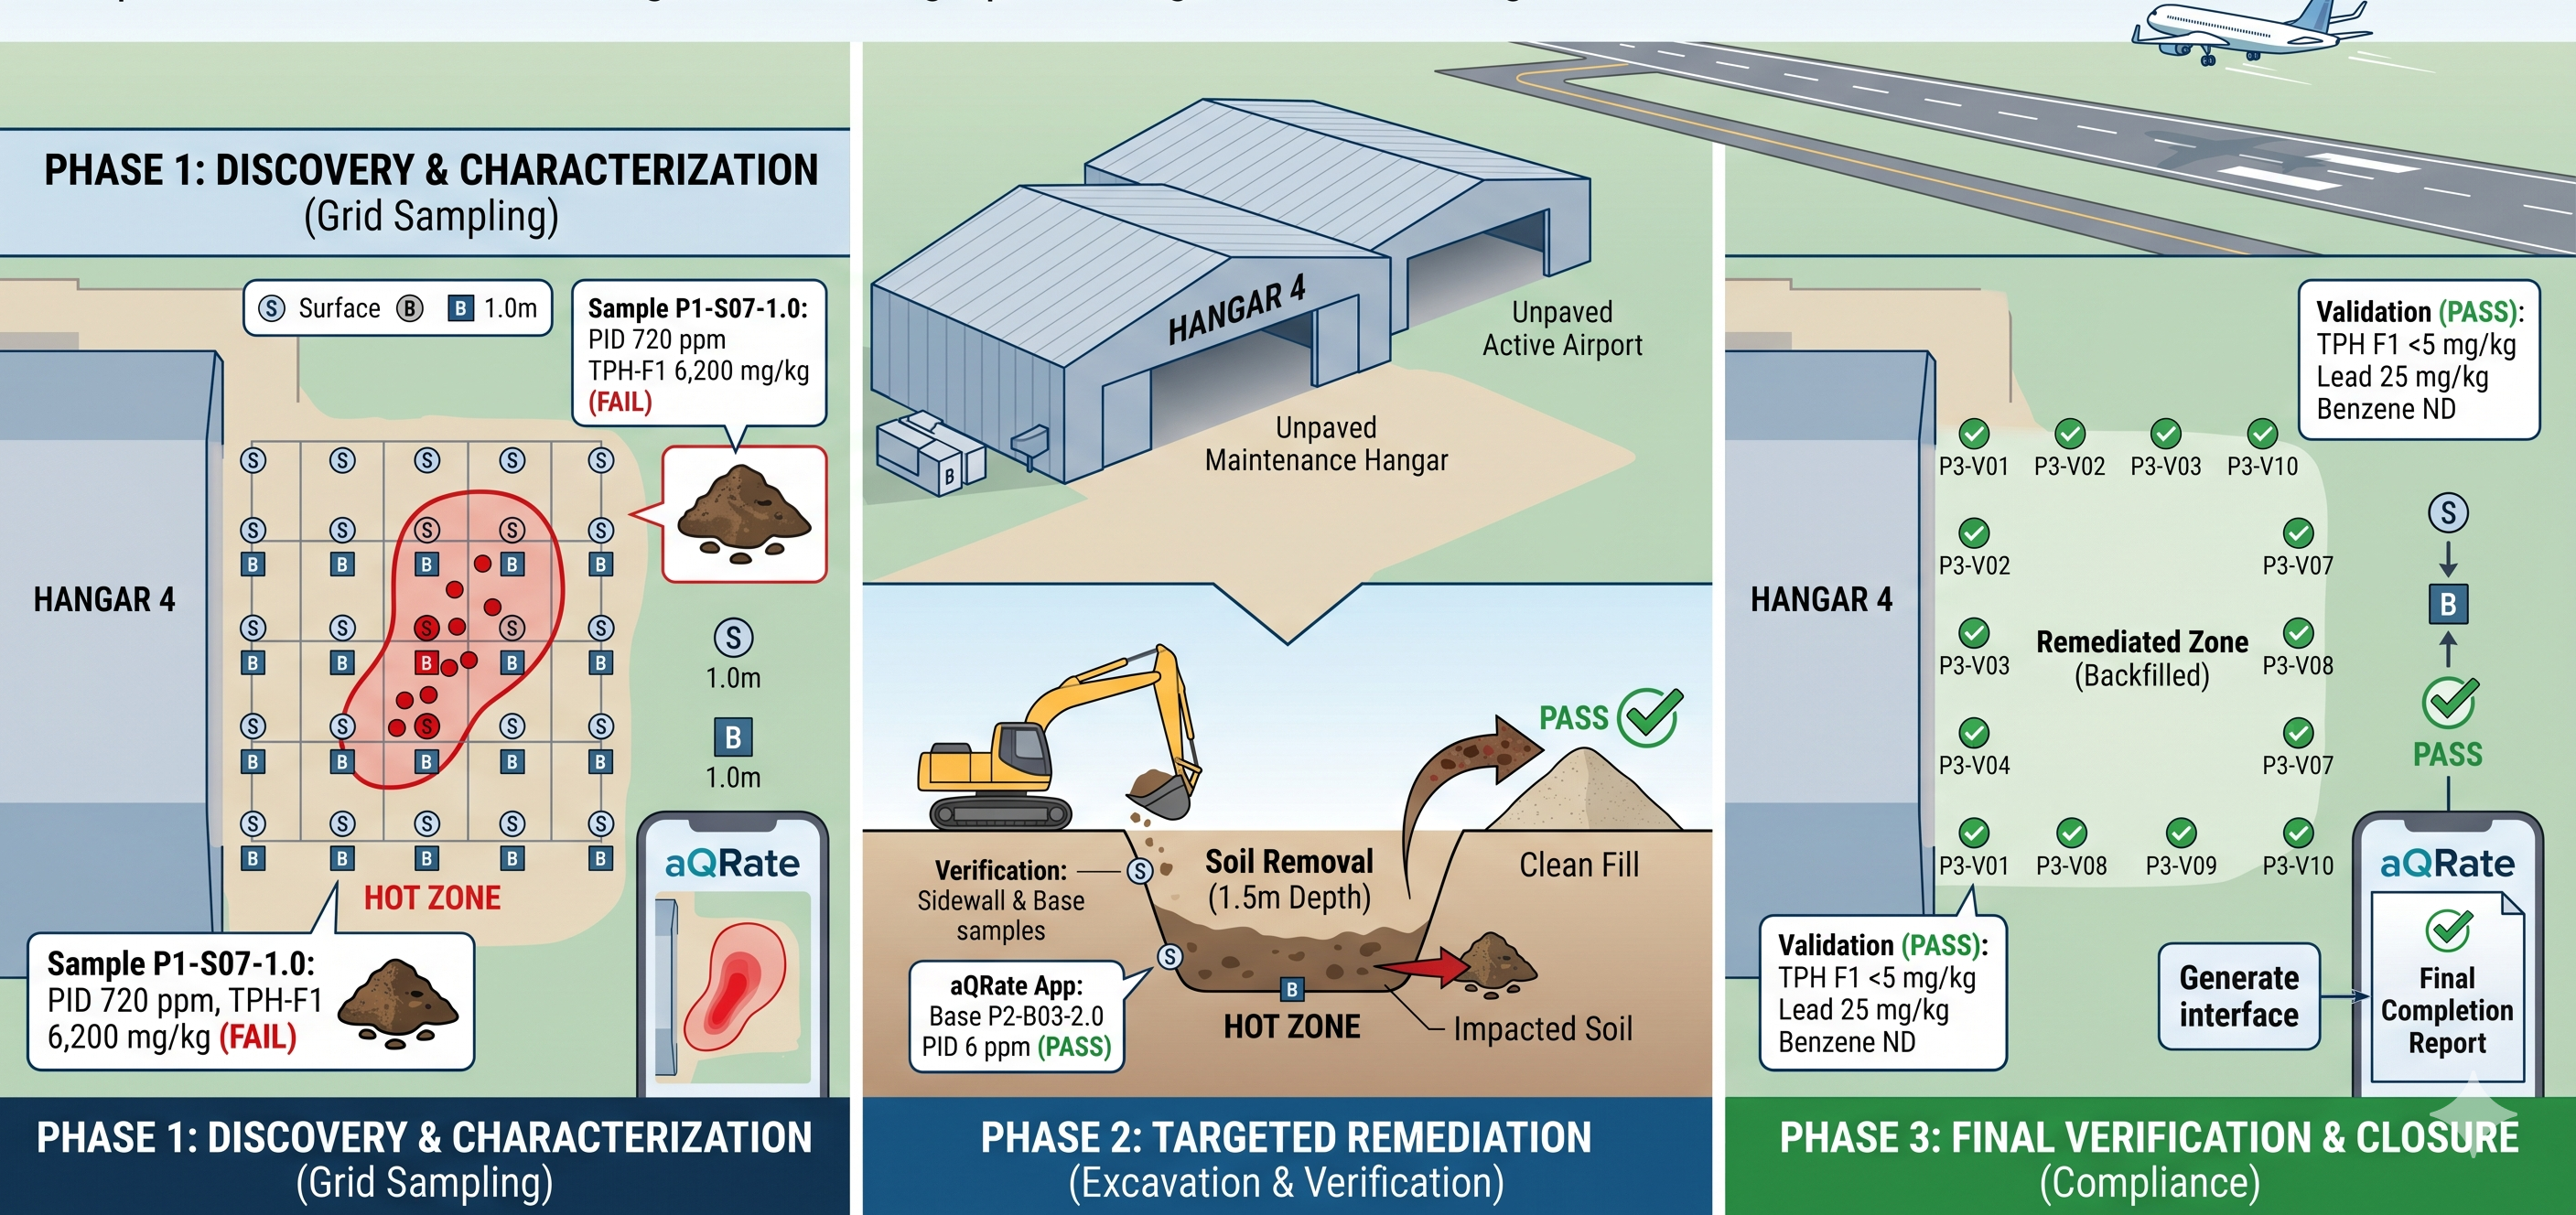
Fig. 1 — Three-phase soil remediation lifecycle: Phase 1 high-density grid characterization, Phase 2 targeted excavation & verification, Phase 3 final compliance validation at the Hangar 4 site, Vulcan, Alberta.
1 Phase 1: Discovery & High-Density Characterization Phase 01
In this hypothetical scenario, a routine Phase II Environmental Site Assessment (ESA) is performed near “Hangar 4.” Using aQRate, data was collected of a high-density 5m×5m sampling grid across a 500m² area.
- The Scope: 20 locations, 40 onsite measurements at two depths of 0.1m and 1m for VOC (via PID measurements), pH and soil temperature. All samples submitted to an environmental lab for TPH-F1, TPH-F2, Lead and Benzene measurements.
- The Discovery: The simulation demonstrates aQRate’s ability to map a contamination plume in real-time. In this model, onsite PID readings reached 720 ppm, while simulated lab results for TPH-F1 (Gasoline range) hit 6,200 mg/kg, well above the Alberta Tier 1 Industrial Limit of 320 mg/kg.
- Platform Value: The demo shows how aQRate visually flags these exceedances as “Red Pins,” providing immediate spatial clarity on where remediation is required.
2 Phase 2: Targeted Remediation Phase 02
With the “Hot Zone” clearly defined on the digital map, the project moves into the corrective action phase: a surgical 1.5m deep excavation of the impacted soil.
- Verification Monitoring: During the dig, aQRate logged 16 verification samples from the sidewalls and the base of the excavation.
- Data-Driven Decisions: The model highlights how field technicians can use aQRate to track declining PID readings in the pit, demonstrating the platform’s utility in determining exactly when the “clean limit” has been reached.
3 Phase 3: Final Verification & Compliance Phase 03
The final phase of the simulation focuses on the “All-Clear.” After the excavation was backfilled with clean soil, aQRate was used for a final round of validation.
- The Results: 10 final sampling points were distributed across the remediated zone. In this phase, all parameters including Benzene and Lead returned as Green, meeting the Alberta Tier 1 thresholds.
- The Deliverable: All data and details from the field work and lab results structured and ready to be used in the Final Environmental Completion Report, showcasing how aQRate aggregates every field note and lab result under one unified umbrella.
Why We Simulate
While the “Hangar 4” event is a hypothetical model, the data management challenges it represents are very real. We created this simulation to show environmental consultants and industrial operators exactly how aQRate:
- Visualizes Complex Data: Turning 100+ data points into a clear, actionable map.
- Automates Compliance: Instantly comparing field and lab data against local regulations (like Alberta Tier 1).
- Ensures Data Continuity: Maintaining a perfect “chain of truth” from the first probe to the final report.
Want to see the data behind this simulation? Contact us for a walkthrough of the aQRate dashboard using this Airport dataset.
Request a walkthrough