
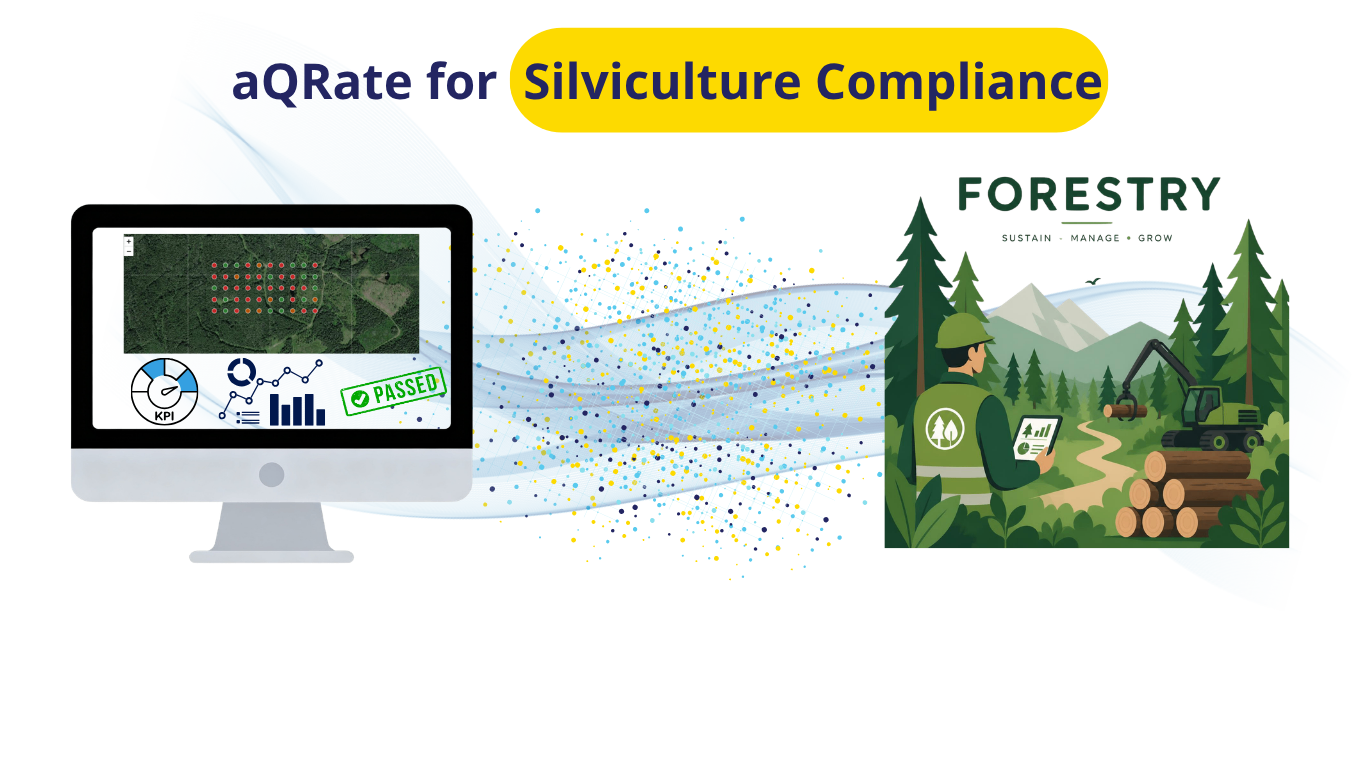
In modern sustainable forestry, tracking reforested cutblocks from initial seedling establishment to long-term canopy dominance is both an ecological necessity and a strict legal mandate. Field arborists and silviculturists rely on rigorous silviculture surveys across Canada to monitor stand establishment, quantify seedling retention, and detect forest health threats early. In British Columbia, these field observations directly inform compliance under the BC Ministry of Forests Stocking Standards, setting legally binding thresholds for stem density, spacing, and brush competition.
To streamline this complex multi-year workflow, the aQRate mobile app and cloud platform digitizes field data collection and automates regulatory analytics across the two foundational survey phases: Phase 1 (Stocking & Survival Surveys) and Phase 2 (Free-to-Grow Assessments). aQRate reduces time spent on manual data handling by 60% and reduces errors by 80%. This is how it unfolds...
Phase 1: Stocking & Survival Surveys
Intent & Purpose
The primary intent of Phase 1 is to evaluate early seedling establishment, survival rates, and crop tree growth trajectories during the critical initial years following harvesting and planting. Conducted typically at Year 1, Year 3, and Year 5 post-harvest across systematic circular plot networks, these surveys verify whether newly planted seedlings are taking root, quantify natural regeneration, and identify early abiotic or biological damage. For forest licensees and forestry consultants, early detection of seedling mortality allows for timely silvicultural interventions such as fill-planting or site preparation before stand density drops below mandatory levels outlined in provincial BC Ministry of Forests Stocking Standards.
The Traditional Manual Approach & Its Challenges
Historically, silviculture crews conducted survival surveys using rite-in-the-rain paper tally sheets, hand-held GPS units, and physical tally counters.
High Transcription & Calculation Error Rates: Field technicians had to manually record stem counts, estimate heights, and assign vigor grades on paper. Back in the office, administrators had to manually re-enter handwritten tally notes into spreadsheets and run plot expansion math (200 x stems) by hand, introducing frequent transcription errors.
Severe Administrative Delays: Compiling seasonal survey data across dozens of cutblocks often took weeks or months, delaying critical decisions on ordering seedling stock for fill-planting.
Data Loss & Weather Hazards: Rain, mud, and harsh field conditions regularly damaged paper sheets, risking total loss of historical plot records.
Lack of Spatial Context: Paper records lacked exact real-time GPS integration, making it difficult to re-locate specific failing plots or visualize expanding mortality patterns across the block.
How aQRate Transforms Phase 1 Data Collection & Management
aQRate completely digitizes Phase 1 by replacing paper forms with a custom, offline-first mobile interface and automated cloud analytics engine. Field crews record crop tree counts, height growth, vigor ratings, and standardized stressor taxonomy directly on mobile tablets, even deep in remote cutblocks without cellular reception.
Offline Capture with GPS Auto-Tagging: Every plot submission automatically captures precise spatial coordinates, timestamp, and device metadata.
Standardized Stressor Dropdowns: Replaces ambiguous handwritten notes with strict categorical dropdowns (CODE: Description), ensuring consistent forest health reporting across field crews.
Instant Cloud Synchronization & Processing: As soon as field devices reconnect to Wi-Fi or cellular networks, data syncs to the aQRate web portal where stand density fluctuations (ex: 1,408 TPH—-> 1,264 TPH —-> 1,136 TPH) and plot pass rates are calculated automatically.
Key Insights & 1-Click AI Visualizations for Phase 1
Post-sync, the platform automatically generates executive analytics and interactive visualizations:
Executive KPI Summary Cards: Instant indicators showing block-wide Mean Trees Per Hectare (TPH), Stocking Pass Rate (> 1,200 TPH threshold), Vigor Distribution (Good, Fair, Poor), and Mean Height Growth.
Interactive GIS Heatmap: A color-coded spatial matrix over high-resolution satellite imagery (Green = Compliant >1,200 TPH, Yellow = At-Risk 800–1,199 TPH, Red = Failed < 800 TPH) with a time-lapse slider to observe timeseries change from Year 1 to Year 5.
Longitudinal Survival & Growth Trajectory Chart: Dual-axis visualization pairing stacked bars (Planted vs. Natural TPH decay) with a line overlay tracking average height growth against provincial benchmarks.
Stressor Root-Cause Treemap: Interactive drill-down donut and treemap charts breaking down primary damage drivers (drought stress, root disease, and brush overtopping).
Automated Fill-Planting Prescription Report: A 1-click exportable PDF detailing failed plot coordinates, stem deficits, primary damage causes, and prescribed replanting actions.
Note: The AI-based visualizations module of aQRate is highly flexible. Visualizations listed above are just a handful of examples for demo purposes. You can create your visual reports the way you want them.
Phase 2: Free-to-Grow (FTG) Assessments
Intent & Purpose
Phase 2 represents the legal finish line for silviculture obligations. Conducted between 7 and 15 years post-harvest according to national silviculture survey guidelines, the Free-to-Grow assessment proves to regulatory authorities that the regenerated forest stand is fully established, well-spaced, and ecologically dominant over competing vegetation. To achieve legal release, crop trees must meet strict height requirements and maintain a height overtopping ratio of at least 125% over surrounding brush and hardwoods. Fulfilling these criteria formally transfers responsibility back to the crown and relieves the licensee of further reforestation liabilities under BC Stocking Standards.
The Traditional Manual Approach & Its Challenges
Evaluating Free-to-Grow compliance manually is one of the most complex tasks in forestry management due to multi-layered evaluation rules.
Complex Multi-Variable Mathematics: Field surveyors had to count total stems, determine which stems met minimum 2.0 m spacing rules ("Well-Spaced Stems"), estimate competing brush height, and manually evaluate whether crop tree height exceeded 125 % of competing vegetation height ("Free-Growing Stems").
High Risk of Compliance Failure: Performing complex ratio calculations and spacing determinations manually in the field frequently resulted in mathematical miscalculations. Declaring a block Free-Growing prematurely could lead to regulatory audit rejections and costly legal penalties.
Manual Reporting Friction: Compiling official government submission packages (such as BC RESULTS filings) required hours of manual data formatting, cross-referencing paper maps, and re-calculating block-wide pass percentages (80 % plot pass threshold).
How aQRate Transforms Phase 2 Data Collection & Management
aQRate eliminates compliance guesswork by embedding complex silvicultural evaluation rules directly into the cloud processing pipeline. Field surveyors simply capture raw counts (Planted Stems, Natural Stems, Well-Spaced Stems), crop tree height, leader growth, competing vegetation height, and brush cover percentage.
Automated Cloud Compliance Calculations: Immediately upon sync, the cloud platform runs multi-variable rule checks across all surveyed plots, auto-calculating Well-Spaced TPH, Free-Growing TPH, and the exact Height Competition Ratio
Automated 3-Tier Classification: The platform categorizes every plot automatically into Free Growing (Pass), Brush Threat (Requires Brushing), or Understocked (Requires Planting).
Block-Level Legal Rollup: Automatically evaluates whether block-wide mean FG TPH meets target standards (>1,200 TPH) and verifies if > 80 % of plots pass, auto-generating audit-ready regulatory packages.
Key Insights & 1-Click AI Visualizations
The Phase 2 dashboard provides silviculture managers with immediate legal clarity:
Cutblock Legal Declaration Card: Displays a prominent Legally Free Growing (Green) banner if Mean FG TPH >1,200 TPH AND Plot Pass Percentage >80 %; otherwise displays Action Required (Red).
Interactive GIS Compliance Map: Spatial map rendering Green markers for Free Growing plots, Yellow triangles for Brush Threat plots, and Red octagons for Understocked plots.
Height Competition Scatter Plot: Graphs crop tree height against brush height for all plots relative to a diagonal 125 % legal overtopping line, visually isolating plots suppressed by canopy competition.
Stocking Density Pipeline Chart: A step-down bar chart illustrating density transitions from Gross TPH-> Well-Spaced TPH ->Free-Growing TPH to pinpoint exact spacing or brush bottlenecks.
This is how aQRate turned all the raw data for this study into insight. Note that the AI-based Visualizations module of aQRate is highly customizable and it can build reports based on what you need, the way you need them. The following is an example of what it created for this demo use case:
👉🔗 Here is the link to the silviculture visualization
Ready to Streamline Your Silviculture Operations?
Transitioning from manual paper tallies to a digitized field-to-cloud workflow is the fastest way to eliminate administrative bottlenecks, protect regulatory compliance, and maximize silviculture project throughput. By cutting manual data handling time by 60% and reducing reporting errors by 80%, aQRate empowers forestry teams to focus on what matters most: growing healthy, resilient forests.
Curious to see how aQRate can transform your environmental and silviculture data collection? Schedule a personalized demo with our team today.