
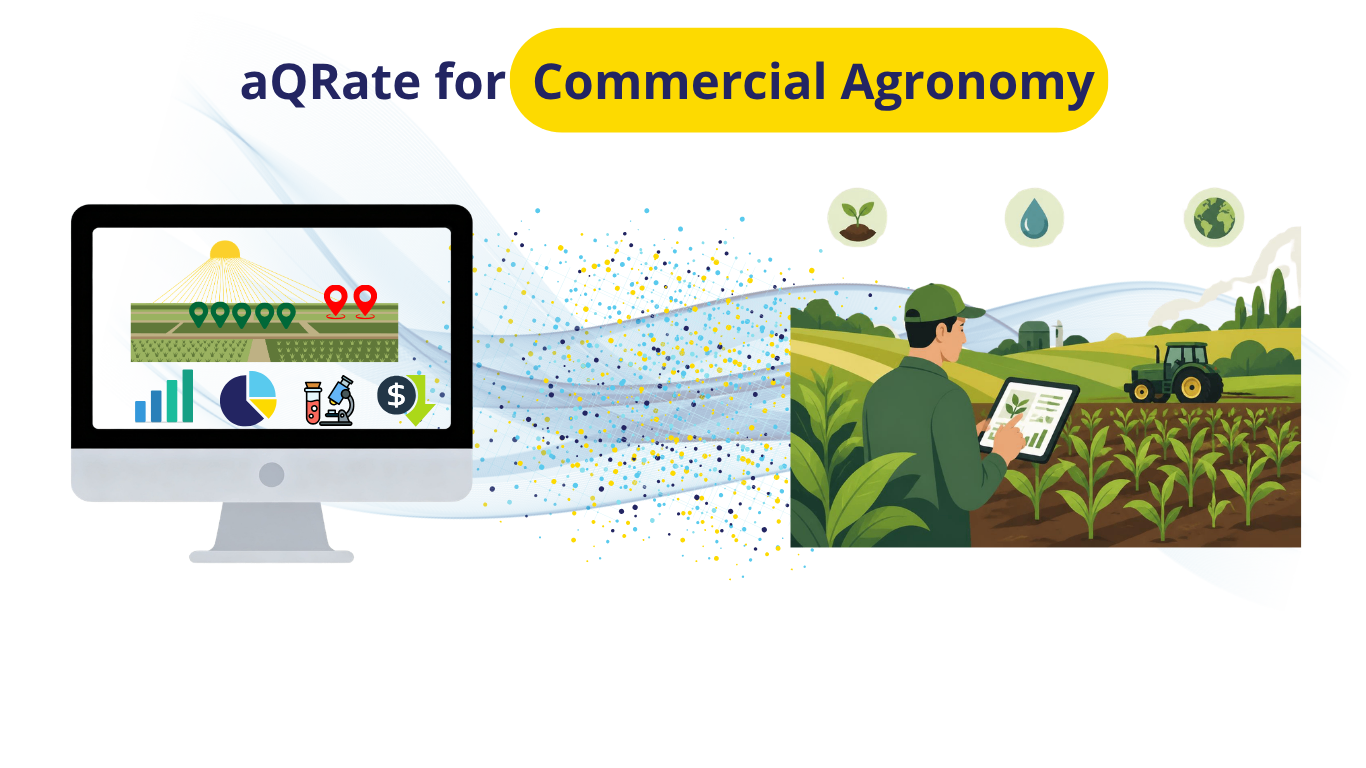
The Sky vs. Ground Paradox in Precision Agriculture
The global precision agriculture market is on track to surpass $13.6 billion, with the specialized crop monitoring and scouting market representing over $3.2 billion of that total. According to technology adoption data from the USDA Economic Research Service, between 68% and 70% of large-scale commercial farming operations actively utilize autosteer, satellite imagery, and yield mapping.
Yet, an operational paradox remains at the heart of modern farming: Satellite imagery and drone flights point the finger, but physical boots on the ground diagnose the disease.
Aerial satellite imagery (such as Sentinel-2 NDVI maps) serves as the "SCADA system of modern farming"—it instantly detects crop canopy stress across thousands of acres. However, as noted in remote sensing research from the SPIE Digital Library, satellite imagery cannot identify why a crop is yellowing without physical calibration. As outlined in Off-Nadir's precision agriculture guide, a stressed patch on a vegetation map looks identical whether it is caused by an invasive soil pathogen like Clubroot, mid-season Nitrogen leaching, or subsoil compaction.
Converting sky-level stress detection into tractor-ready Variable Rate Application (VRA) spray maps requires physical ground-truthing by an agronomist walking "W" sampling patterns in the mud. Without a unified digital field workflow, the critical handoff between field scouting and sprayer execution collapses into a mess of scribbled field notebooks, unorganized phone photos, and vague text messages.
The Scenario: High-Stakes Diagnostics in Central Alberta
Consider a 5,000-acre corporate farm operation in Central Alberta (Kneehill County) running a high-yield Canola and Spring Wheat rotation. Early season satellite imagery highlights yellowing vegetation anomalies across two specific 160-acre quarter-sections: Field #12 (Canola) and Field #18 (Spring Wheat).
An independent crop consultancy firm is dispatched to ground-truth these anomalies before yield potential is permanently compromised.
Field #12: Canola (Brassica napus) — Soil Pathogen & Biosecurity Inspection
Growth Stage: Rosette (BBCH 30 Stem Elongation). This is the critical diagnostic window where root galls are distinct, soft, and clearly visible upon excavation.
The Diagnostic Task: The agronomist walks a 15-waypoint "W" pattern, digging plant root balls, rating root gall severity on a 0–3 scale, taking handheld soil pH probe readings, and collecting soil core samples bound for lab testing.
High-Stakes Risk: Clubroot (Plasmodiophora brassicae) is a regulated, soil-borne pathogen. If tractor machinery drives through an unmanaged hotspot, resting spores will spread across the remaining 4,840 acres, threatening catastrophic long-term crop failure.
Field #18: Spring Wheat (Triticum aestivum) — Mid-Season Nitrogen Deficiency
Growth Stage: Flag Leaf (Feekes 8). The flag leaf contributes up to 75% of grain head fill; nutrient deficits at this stage cause immediate, unrecoverable yield loss.
The Diagnostic Task: Heavy spring rains have leached nitrogen into lower subsoils. The agronomist takes handheld SPAD chlorophyll meter readings, records visual leaf chlorosis ratings (1–5 scale), and clips leaf tissue samples for laboratory N-P-K panel analysis.
High-Stakes Risk: Liquid UAN fertilizer is expensive. A flat-rate blanket application across 160 acres wastes thousands of dollars on healthy zones, while under-feeding critical hotspots.
The Pain Point: The Broken Field-to-Report Workflow
Currently, field scouts use basic smartphone maps, freeform notes, and physical bag markers. The traditional workflow breaks down across three major operational friction points:
Fragmented Data Logs: The agronomist takes photos on a phone, writes soil pH and SPAD numbers in a paper notebook, and sticks paper tags on physical sample bags. Un-tagged camera photos lose spatial context within hours.
The Transcribing Night: After 10 hours in muddy fields, the agronomist spends 3 hours at night re-typing paper notes into spreadsheets and manually formatting client PDF reports.
Non-Spatial Client Deliverables: The farmer receives a phone call or text: "Found severe yellowing and root galls in the north field." Lacking exact spatial boundaries (.SHP or ISO-XML files), the farmer cannot upload precision prescriptions to their John Deere or Case IH sprayers.
The aQRate Solution: One Verified Record from Field to Tractor Cab
Using aQRate, the agronomist completes an end-to-end digital data collection lifecycle directly from an offline mobile device:
Offline Spatial Collection: The agronomist logs exact GPS coordinates (latitude/longitude) at every inspection point along the "W" pattern, even in complete cellular dead zones.
Cascading Conditional Form Logic: Selecting Crop Type = Canola automatically restricts options to canola growth scales (Stem Elongation --> Rosette (BBCH 30)) and exposes biosecurity fields (Root Gall Score 0–3, Field Soil pH). Selecting Spring Wheat populates cereal scales (Feekes 8 Flag Leaf) and nutrient fields (SPAD Score, N-Chlorosis Rating).
Sample ID Chain-of-Custody: Physical soil cores (SAMP-CAN-101) and leaf tissue bags (SAMP-WHT-201) are assigned unique IDs in the app, linking physical lab submissions directly to GPS coordinates.
Instant Cloud Synchronization: As soon as the agronomist returns to cellular coverage, data syncs automatically to the cloud platform—eliminating evening paperwork entirely.
Turning Field Data into Actionable Insights & Measurable ROI
When field submission records combine with verified analytical laboratory results (Pathotype 3H Strain Confirmed, Soil Nitrate Depleted), aQRate transforms raw data into three high-value visual dashboard assets. Note that the AI-based Visualizations module of aQRate is highly customizable. It can create visual reports based on your needs. The followings are just some examples of its capabilities for this specific demo use case:
1. Interactive Spatial Map & Biosecurity Hotspots
The platform renders color-coded waypoint pins over satellite field boundaries. On Field #12 (Canola), the dashboard flags a severe acidic pocket (pH 5.7) harboring 42,000,000 spores/g of soil directly at the primary field entrance. The farm manager receives an instant alert: "Mandatory track equipment wash-down at Gate 12 before moving machinery to clean fields."
👉🔗 Link to the Interactive Spatial Map Visualizations
👉🔗 Link to the Biosecurity Hotspots Visualizations
2. Variable Rate Application (VRA) Savings Calculator
Instead of flat-rate blanket spraying, aQRate interpolates waypoint SPAD scores across Field #18 to generate precision management polygons for liquid UAN top-dressing.
👉🔗 Link to the VRA Saving Calculator
Unified Value Across the Agribusiness Lifecycle
For the Crop Consultant: Cuts report generation time from 3 hours a night to zero. Captures verified, georeferenced data with complete sample custody.
For the Farm Manager: Eliminates chemical waste, saves $10,120 per 160-acre field in fertilizer costs, and prevents multi-million dollar biosecurity disease outbreaks.
For the Ag Retailer: Ensures complete traceability from initial field observation to lab sample submission and final product delivery.
Upgrade Your Precision Agronomy Workflows
Stop wasting agronomy hours on manual note transcription, scattered spreadsheets, and un-tagged field photos. Contact the aQRate team today to see how our field-to-report workflow transforms your crop scouting workflows, sample tracking, and precision farm management programs.