
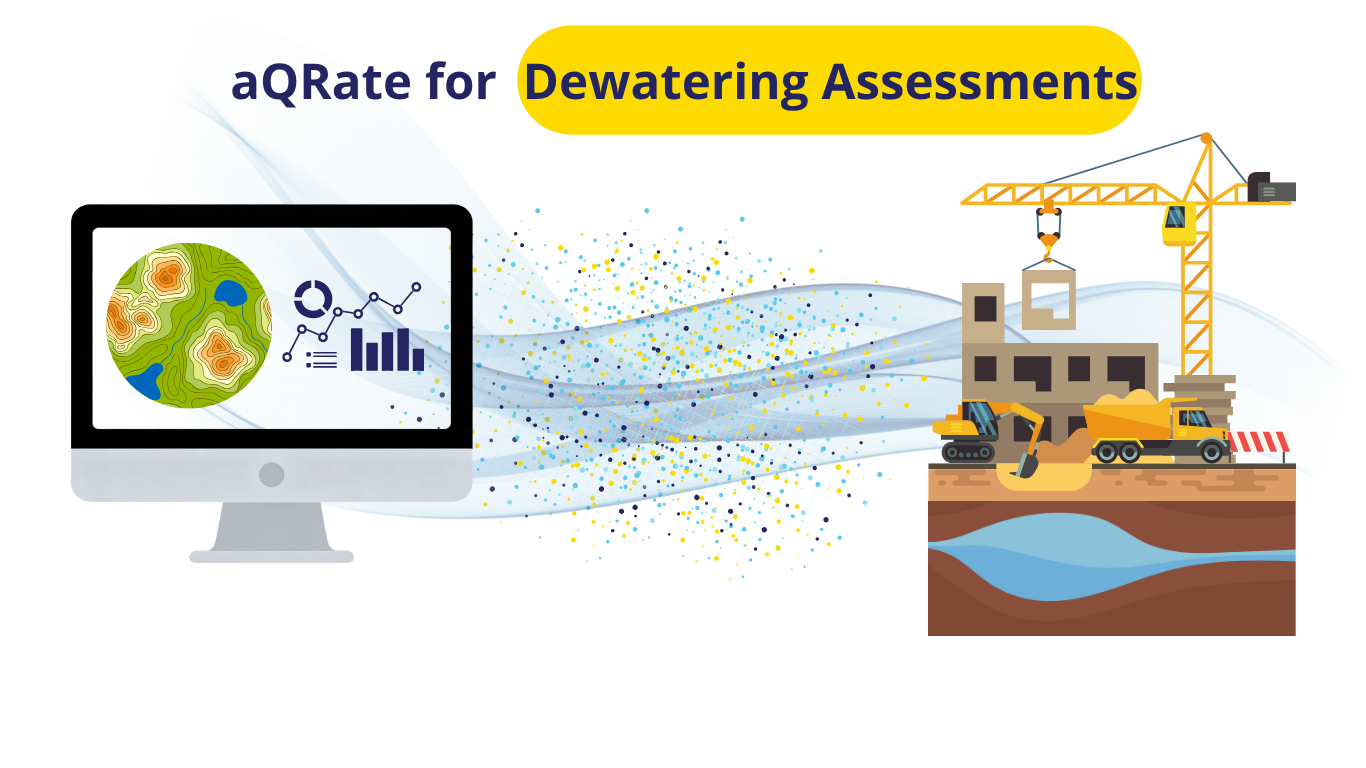
When managing deep excavations, the gap between your geotechnical data, your live dewatering assessment, and your ultimate decision-making can mean the difference between a successful project and an expensive structural failure.
Historically, this engineering workflow has been painfully fractured across four isolated stages:
1. Manual Field Logging: Drilling crews log refined 1.5m intervals on paper or isolated Excel sheets, capturing index metadata like USCS codes, SPT N-values, and Recovery percentages.
2. Disconnected Lab Entry: Particle index testing results (Gravel, Sand, and Fines %) are delivered weeks later and manually typed or copy-pasted into the records.
3. Siloed Borehole Creation: Borehole logs are drafted manually using siloed software, printed off or emailed down the hall to hydrologists.
4. Data Fragmentation: The hydrogeology team collects groundwater level data manually on separate clipboards and manually re-types all of it into separate groundwater modeling tools to obtain critical decision-making outputs like hydrographs and drawdown cones.
The aQRate Transformation
aQRate changes everything by replacing the manual data shuffle with a seamless, end-to-end infrastructure.
Instead of waiting for paper trails to catch up, the geotechnical team collects all necessary borehole data directly on their phones or tablets. Particle index testing lab results are linked automatically to the field data, and detailed borehole logs are visualized with a single click, instantly shared with the hydrogeology team.
When the 72-hour constant-rate dewatering assessment launches, groundwater level data is collected natively in the field using the aQRate mobile app. Rather than logging a mountain of number cells, all field data and lab results are integrated into dynamic visualization reports that include groundwater level heatmaps, contours, and 3D drawdown cone timeseries, all with one click.
Interactive Demo Insights: From Raw Data to 1-Click Outputs
To demonstrate what is possible when your infrastructure is unified, we recently executed a demo use case consisting of two detailed borehole logs, 72 hours of groundwater levels tracked across a pumping well and four observation wells, and physical water samples submitted for laboratory TSS, Benzene, and TPH analysis.
Explore the automated, interactive visualization outputs generated natively by aQRate below:
Borehole Log – Multiple View: 🔗👉Explore Subsurface Profiles
Dewatering Assessment Report: 🔗👉Review Live Hydrogeological Model
Important Notes: While these visualizations represent the ultimate end goal for any infrastructure project, this level of detailed, 1-click report generation would be impossible without aQRate’s backend pipeline handles data collection and management seamlessly from end to end. Here is a 🔗👉quick look at how aQRate provides this foundation.
Scale Efficiency, Not Headaches
This use case demonstrated how manual data handling steps can delay projects deliverable, especially when multiple teams are involved to handle different aspects of the project. By bridging the gap between field collection, laboratory analysis, and final reporting, aQRate cuts reporting turnaround times by up to 50% while completely removing the risk of human error.
Want to stop fighting manual data silos on your next project? Let aQRate handle all your field data collection, management and use needs seamlessly. Ready to see how aQRate can modernize your team's data workflows? 🔗👉Book a brief 15-minute demo today.