
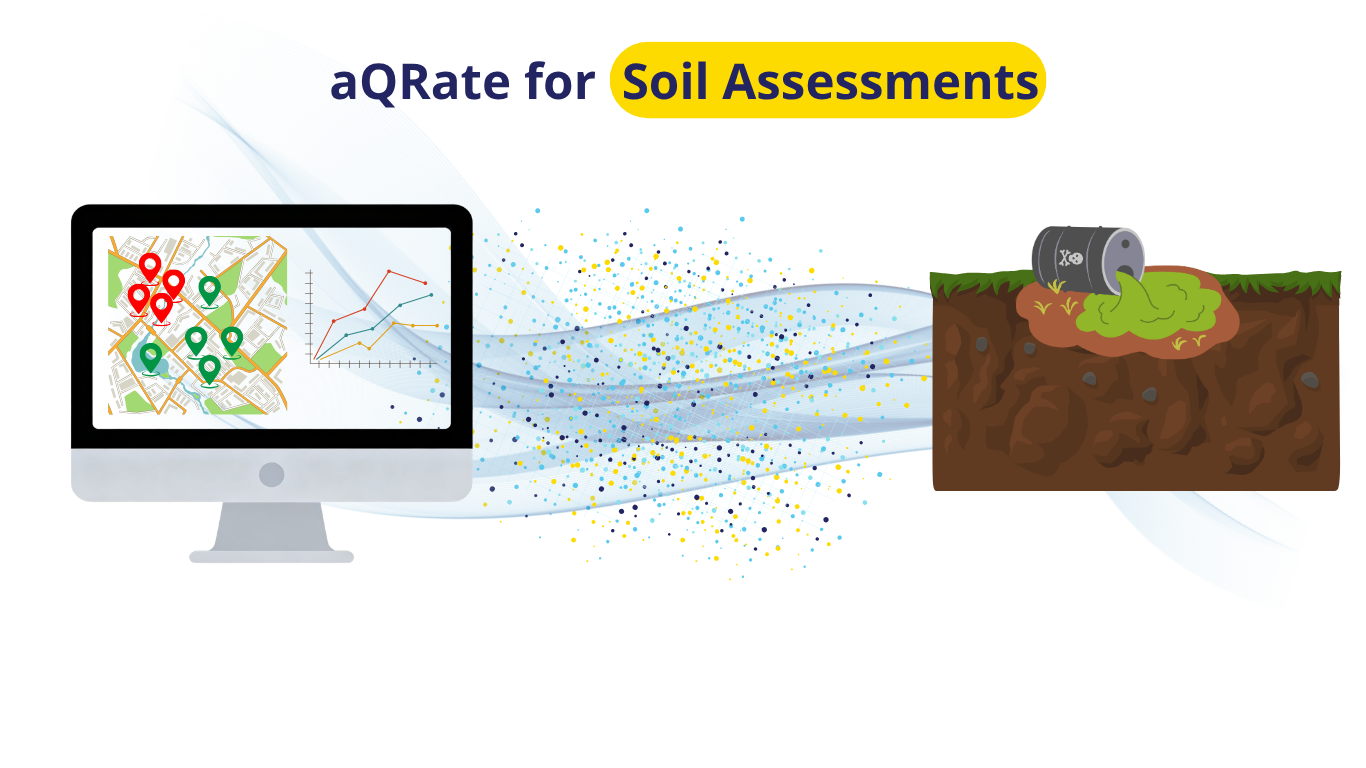
Environmental Site Assessments (ESAs) involving soil sampling and remediation are inherently data-heavy. Field teams constantly struggle to coordinate paper logs, field instruments, chains of custody, and a barrage of laboratory reports.
Answering critical project questions—such as "Which samples exceeded regulatory thresholds?", "Where exactly is the contamination hot zone?", and "How large does the excavation zone need to be?" historically required days of funneling raw data into drafting and modeling software. If your workflow relies on manual data handling, it creates a massive drag on staff time and project resources.
To demonstrate how a seamless digital infrastructure eliminates these bottlenecks, Roshan Water created a simulated end-to-end model project using our field data and collection & management platform, aQRate.
Phase 1: High-Density Characterization (The Discovery)
In this demo use case scenario, we simulated a routine Phase II Environmental Site Assessment (ESA) for a contaminated site. Field technicians mapped out a dense grid, logging 30 total records across 15 distinct locations at multiple depths of 0.1 m and 1 m.
Rather than manually collecting field measurements and field notes on a sheet, field crews used aQRate’s app. ALL the data was collected in one package, eliminating the need for future processing and database integration in the office.
Phase 2: Automated Lab Processing & Hot Zone Mapping
Once the fieldwork was complete, lab Chain of Custody (CoC) were generated with 1 click on aQRate’s platform. After receiving the lab results, the analytical lab results were uploaded to the system. This is where aQRate’s automated data validation shines:
● Instant Auto-Linking: The platform automatically linked every lab parameter directly back to the respective field sample ID and GPS coordinate.
● Regulatory QC Tagging: The platform evaluated the results against the Alberta Tier 1 Soil Remediation Guidelines (Industrial/Coarse thresholds).
Exceedances—such as a Benzene hit of 12.5 mg/kg (threshold: 0.078 mg/kg) and TPH-F1 reaching 6,200 mg/kg (threshold: 320 mg/kg)—were instantly flagged with Red QC tags on the dashboard.
● Advanced Visual Contouring: Using the AI-based Visualizations tool, aQRate generated an 🔗👉interactive map utilizing 4 distinct contouring methods to delineate the plume, calculate the precise surface area of the contamination hot zone, and pinpoint the exact GPS coordinates for the remediation boundaries. Here is the interactive 🔗👉Visualizations report.
Bridging the GPS Accuracy Gap
While this visualization highlights the automated ideal for project reporting, our internal testing during this simulation highlighted a common field hurdle: standard mobile phone GPS chips often lack the precision required for tight environmental grids.
To solve this, Roshan Water is actively collaborating with Juniper Systems to seamlessly integrate high-accuracy external GPS readers directly into the aQRate application interface, ensuring your mapped contours are accurate down to the sub-meter level.
Important Notes: While the Visualizations above is an example of the end goal for any project, this level of detailed 1-click report generation would have been impossible without aQRate’s infrastructure in seamless end to end data collection & management. Here is a 🔗👉quick video showing how different components of aQRate play a role in projects like the one above.
Ready to see how aQRate can modernize your team's inspection data workflows? 🔗👉Book a brief 15-minute demo today.